Generate Temperature Report
For thermal cameras, you can generate a report to show the number of exceptions (temperature too high or too low) and maximum/minimum temperature of different thermometry points on different presets.
- Click Intelligent Analysis on the Home page and then select Temperature Analysis on the navigation panel on the left to enter the Tempeature Analysis page.
-
Select thermal camera(s) for statistics.
-
Click
 in the camera
panel.
in the camera
panel.
-
Select a current site or Remote Site from the drop-down site list to
show its thermal cameras.
Note:
Only thermal cameras will be displayed here.
-
Check the thermal camera(s) for statistics.
The cameras will be added to the camera list.
-
Click
-
Select the preset(s) configured on the camera and the system will collect the
data on the thermometry point in these presets.
Note:
For configuring the thermometry point with temperature measurement rules, refer to the user manual of the thermal camera.
-
Select the report type as daily report, weekly report, monthly report, annual
report, or customize the time interval for a report.
- Daily Report
-
Daily report shows data on a daily basis. The system will calculate the temperature data detected in each hour of one day.
- Weekly Report, Monthly Report, Annual Report
-
As compared to daily report, weekly report, monthly report, and annual report can be less time-consuming, since they are not to be submitted every day. The system will calculate the temperature data detected in each day of way week, in each day of one month, and in each month of one year.
- Custom Time Interval
-
Users can customize the days in the report to analyze temperature data detected in each day or month of the custom time interval.
-
Set the time or time period in the Time field for statistics.
Note:
For custom time interval report, you need to set the start time and end time to specify the time period.
-
Click Generate Report.
The temperature statistics of all the selected presets are displayed in the right panel.
Figure 1. Temperature Report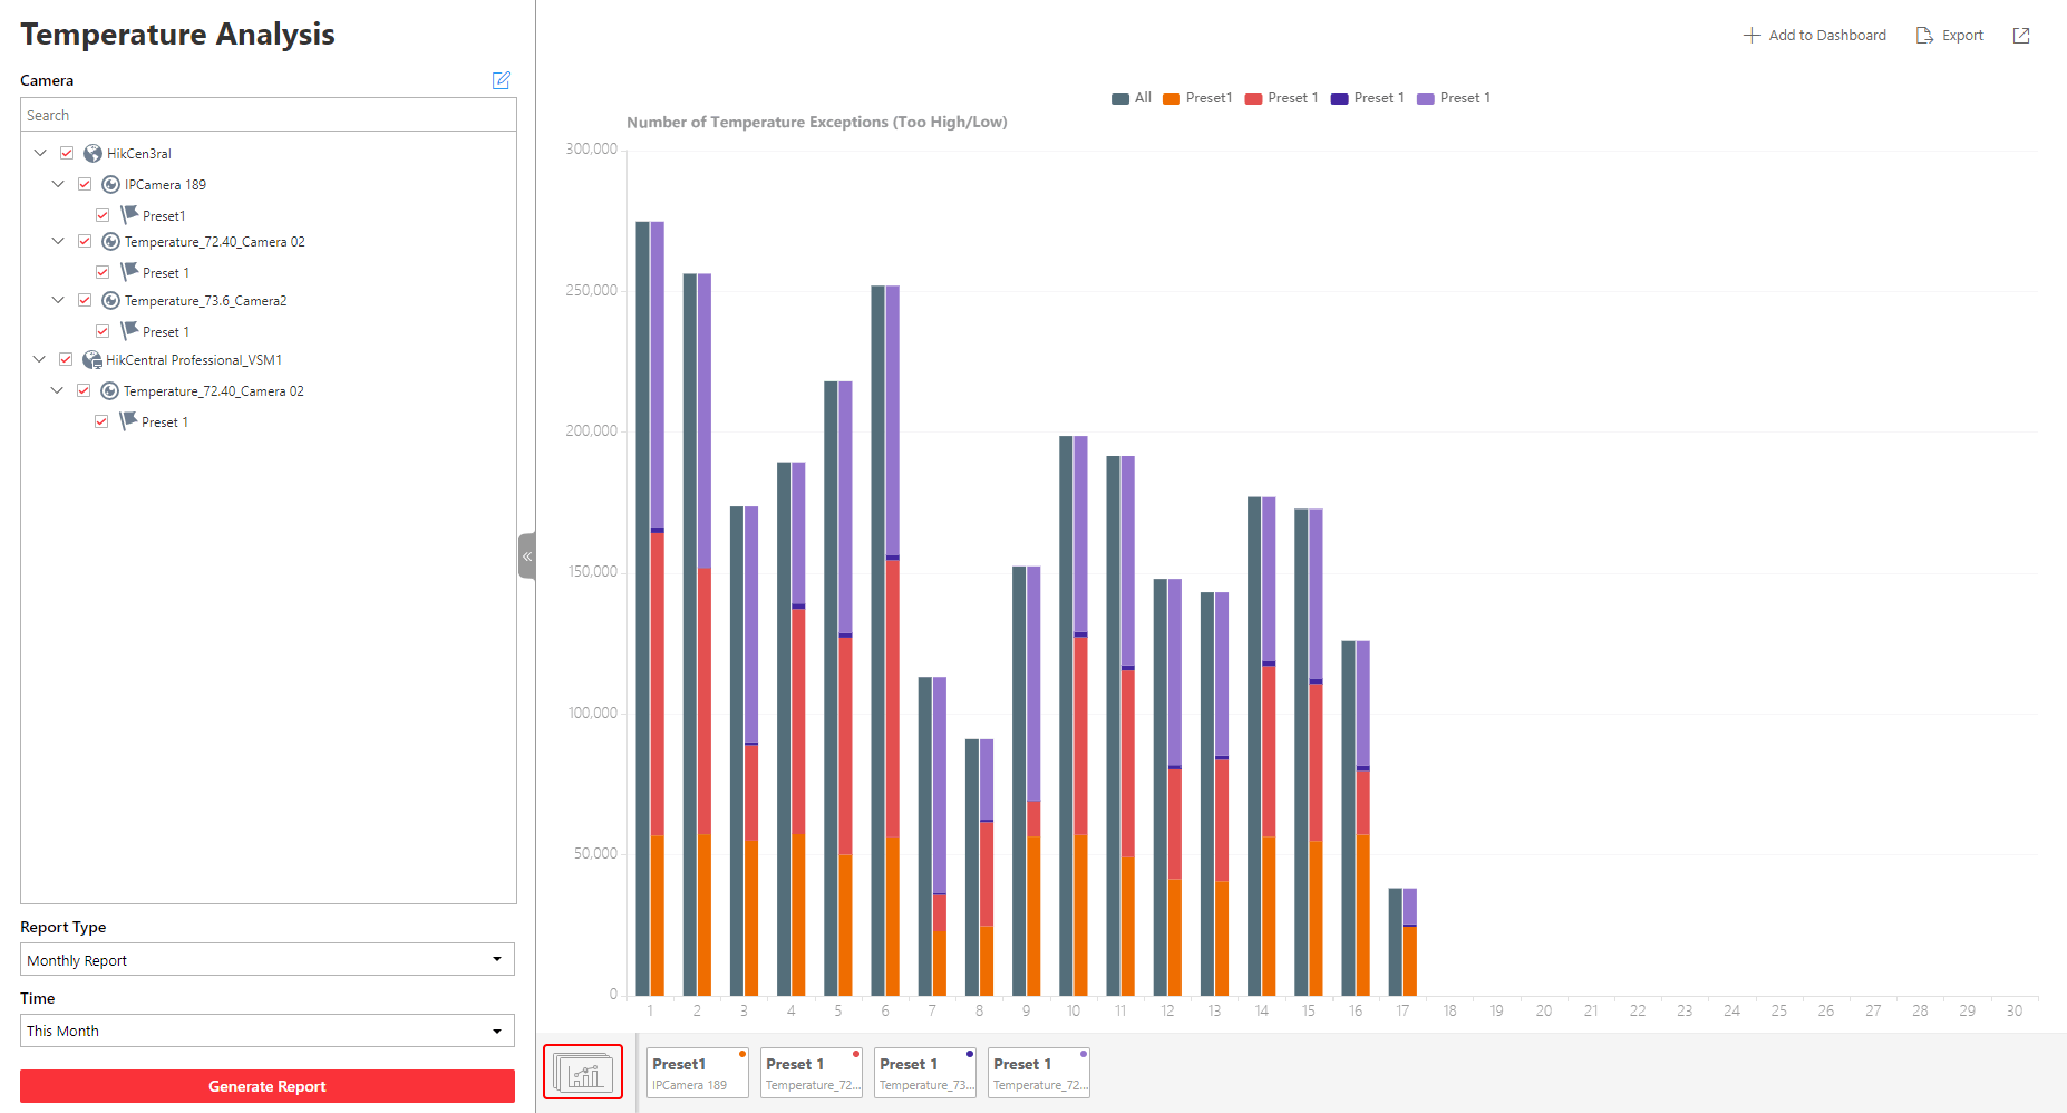
- Optional: Perform the following operation(s) after generating the temperature report.
- Legal Information
- Symbol Conventions
- About Web Client
- Login
- Download Mobile Client
- Web Control
- Manage License
- Manage Resource
- Create Password for Inactive Device(s)
- Edit Online Device's Network Information
- Manage Encoding Device
- Add Detected Online Device
- Add Encoding Device by IP Address or Domain Name
- Add Encoding Devices by IP Segment
- Add Encoding Devices by Port Segment
- Add Encoding Device by Hik-Connect DDNS
- Add Encoding Device by Device ID
- Add Encoding Devices by Device ID Segment
- Add Encoding Devices in a Batch
- Limit Bandwidth for Video Downloading
- Set N+1 Hot Spare for NVR
- Network Transmission Device Management
- Upgrade Device Firmware
- Restore/Reset Device Password
- Manage Remote Site
- Manage Application Data Server
- Manage Recording Server
- Manage Streaming Server
- Manage DeepinMind Server
- Add Security Audit Server
- Manage Smart Wall
- Manage Area
- Add Area
- Add Element to Area
- Edit Element in Area
- Edit Camera for Current Site
- Configure Visual Tracking
- Configure Smart Linkage
- Edit Door for Current Site
- Edit Elevator for Current Site
- Edit Radar for Current Site
- Edit Alarm Input for Current Site
- Edit Alarm Output for Current Site
- Edit Under Vehicle Surveillance System for Current Site
- Edit Third-Party Integrated Resource for Current Site
- Edit Element for Remote Site
- Remove Element from Area
- Manage Resource Group
- Configure Recording
- Configure Event and Alarm
- Manage Map
- Manage Person List
- Manage Visitor
- Manage Access Control and Elevator Control
- Flow Chart
- Manage Access Control Device
- Manage Elevator Control Device
- Manage Access Level
- Access Control Test
- Advanced Functions
- Manage Video Intercom
- Flow Chart
- Manage Video Intercom Device
- Batch Link Persons with Indoor Station
- Relate Doorbell with Indoor Station
- Configure Device Parameters
- Manage Time and Attendance
- Flow Chart
- Add Attendance Group
- Add Timetable
- Add Shift Schedule
- Assign Shift Schedule to Attendance Group
- Configure Attendance Parameters
- Manage Attendance Record
- Search Attendance Record
- Correct Attendance Record for Single Person
- Correct Check-In/Out for Multiple Persons
- Apply for Leave for Single Person
- Apply for Leave for Multiple Persons
- Manually Calculate Attendance Results
- Export Attendance Records
- Get Attendance Records from Device
- View Attendance Handling Records
- Configure Attendance Report
- Manage Entrance and Exit
- Manage Facial Comparison
- Dock Station
- Manage Security Control
- Manage Security Control Device
- Add Detected Online Device
- Add Security Control Device by IP Address
- Add Security Control Device by Hik-Connect DDNS
- Add Security Control Devices by IP Segment
- Add Security Control Devices by Port Segment
- Add Security Control Device by Device ID
- Add Security Control Device by Device ID Segment
- Add Security Control Devices in a Batch
- Add Security Control Partitions from Device
- Configure Defense Schedule Template
- Manage Security Control Device
- Manage Role and User
- Maintenance
- Manage System Security
- System Configuration
- Set Site Name
- Set User Preference
- Set Warning Threshold for Server Usage
- Set Printer
- Set NTP
- Set Active Directory
- Enable Receiving Generic Event
- Allow for Remote Site Registration
- Register to Central System
- Device Access Protocol
- Set WAN Access
- Set Network Timeout
- Set Device Access Mode
- Set IP Address for Receiving Device Information
- Set Data Retention Period
- Set Holiday
- Set Email Template
- Send Report Regularly
- Enable Evidence Collection
- Set Transfer Protocol
- Set Camera ID
- Export Service Component Certificate
- Set Database Password
- Set Health Check Frequency
- Add Fuzzy Matching Rules for License Plate Search
- Configure System Hot Spare
- Set Third-Party Integration
- Data Interchange
- Reset Device Network Information
- Set SUP Upgrade Prompt
- Monitoring
- Intelligent Analysis Report
- Skin-surface Temperature
- Important Ports
Generate Temperature Report
For thermal cameras, you can generate a report to show the number of exceptions (temperature too high or too low) and maximum/minimum temperature of different thermometry points on different presets.
- Click Intelligent Analysis on the Home page and then select Temperature Analysis on the navigation panel on the left to enter the Tempeature Analysis page.
-
Select thermal camera(s) for statistics.
-
Click in the camera
panel.
-
Select a current site or Remote Site from the drop-down site list to
show its thermal cameras.
Note:
Only thermal cameras will be displayed here.
-
Check the thermal camera(s) for statistics.
The cameras will be added to the camera list.
-
Click
-
Select the preset(s) configured on the camera and the system will collect the
data on the thermometry point in these presets.
Note:
For configuring the thermometry point with temperature measurement rules, refer to the user manual of the thermal camera.
-
Select the report type as daily report, weekly report, monthly report, annual
report, or customize the time interval for a report.
- Daily Report
-
Daily report shows data on a daily basis. The system will calculate the temperature data detected in each hour of one day.
- Weekly Report, Monthly Report, Annual Report
-
As compared to daily report, weekly report, monthly report, and annual report can be less time-consuming, since they are not to be submitted every day. The system will calculate the temperature data detected in each day of way week, in each day of one month, and in each month of one year.
- Custom Time Interval
-
Users can customize the days in the report to analyze temperature data detected in each day or month of the custom time interval.
-
Set the time or time period in the Time field for statistics.
Note:
For custom time interval report, you need to set the start time and end time to specify the time period.
-
Click Generate Report.
The temperature statistics of all the selected presets are displayed in the right panel.
Figure 1. Temperature Report
- Optional: Perform the following operation(s) after generating the temperature report.