Generate Queue Analysis Report
For cameras which support queue management, you can generate a report to show the number of queue exceptions and number of persons in each queue, and show the queue status including waiting duration and queue length.
Add a camera which supports queue management to the system and configure queue regions. To configure the queue region, refer to user manual of the camera.
-
Select camera(s) for statistics.
-
Click
 in the camera
panel.
in the camera
panel.
-
Click
-
Click Generate Report.
A chart are displayed in the right panel, showing the number of exceptions (waiting timeout or people amount exceeding) of different queues.
Figure 1. Queue Analysis Report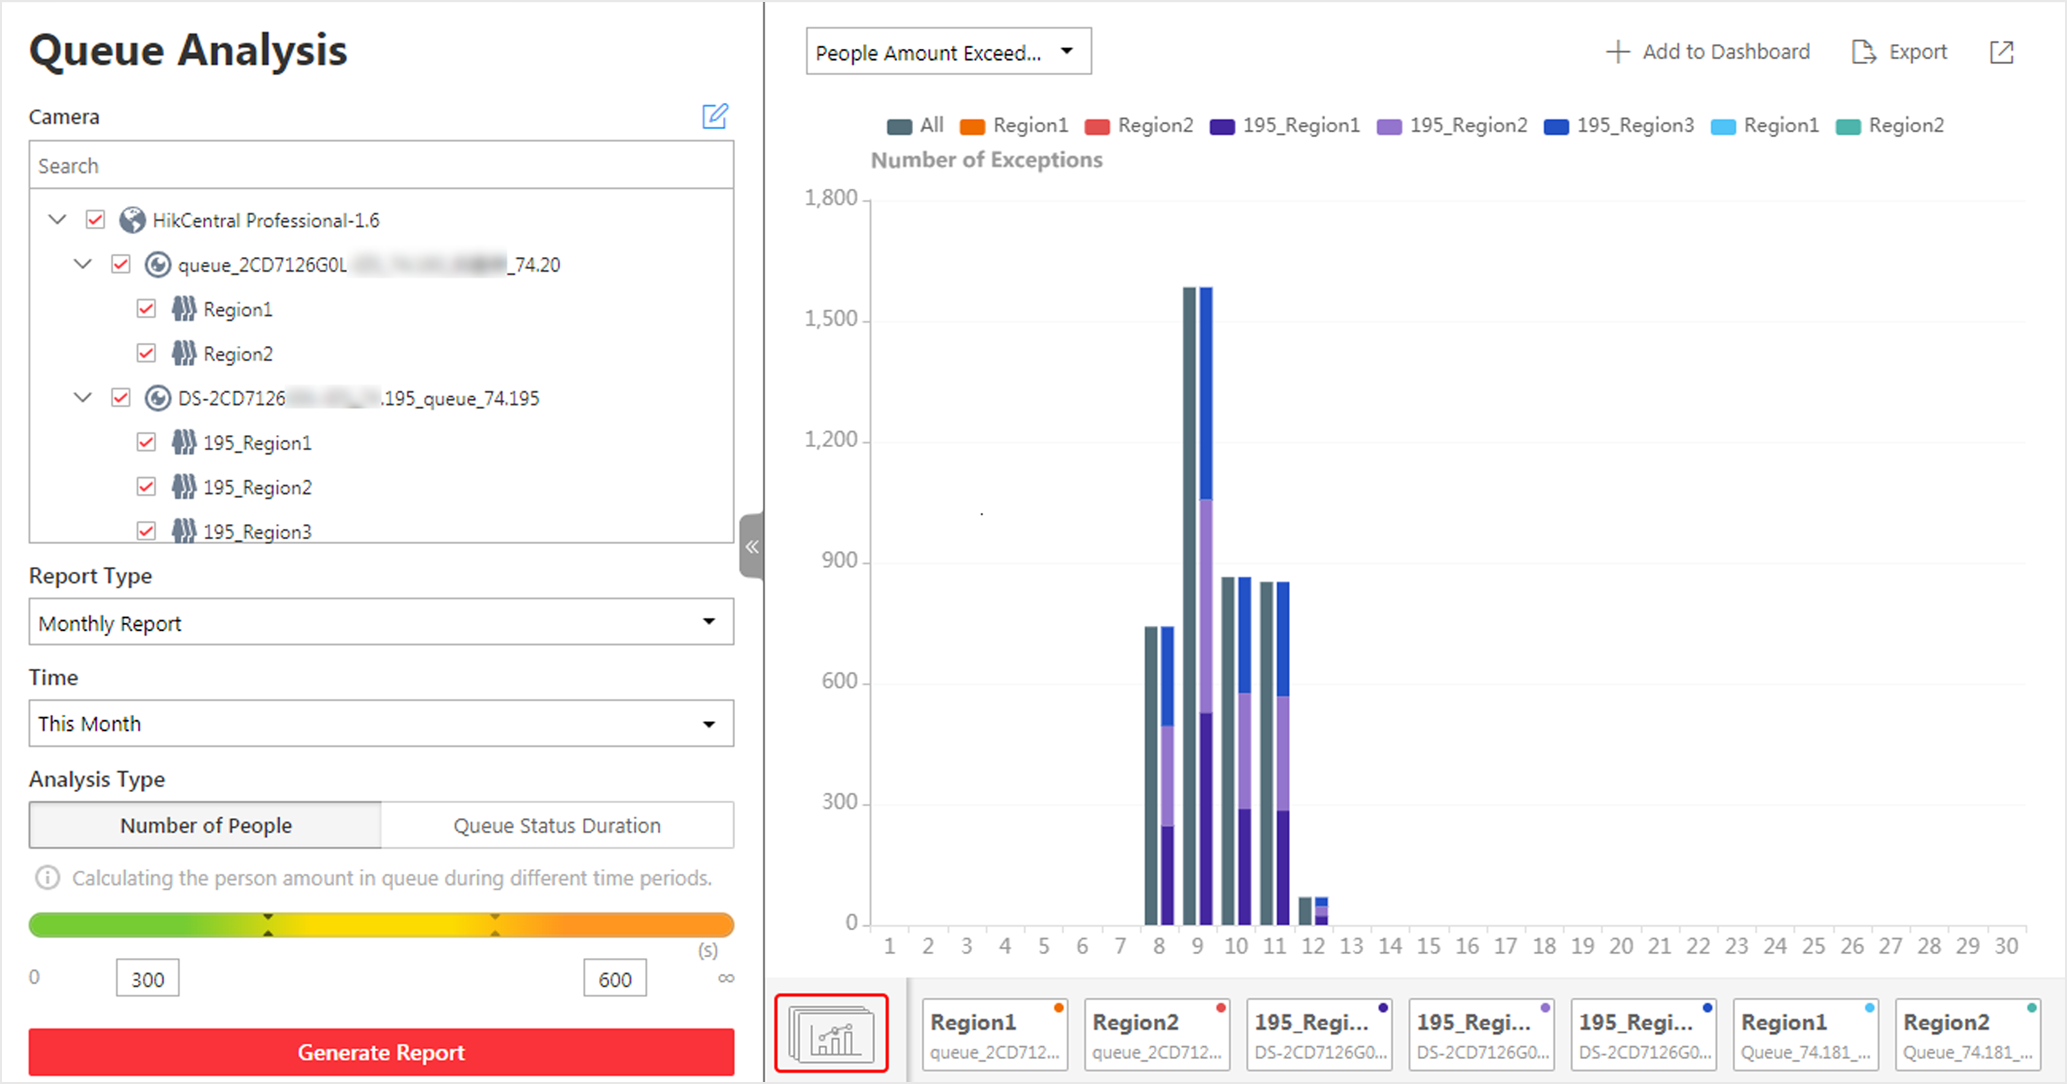
- Optional:
Perform the following operation(s) after generating the report.
Option Description Show/Hide Certain Data
Click the legend to show or hide the data of certain element, such as queue.
View Queue Analysis Report of Single Queue
Click the queue icon on the page below to view the report of the single queue, including the number of exceptions, number of people in the queue, and waiting durations .
Switch Between Number of Exceptions, Number of People, and Queue Length
Click
 on the page below to
view the report of all the selected queues.
on the page below to
view the report of all the selected queues.If you select the report type as Daily Report, Weekly Report, or Monthly Report, and set the analysis type as Waiting Duration, click the drop-down list to view the number of waiting timeout exceptions, or number of people in different and all queues.
If you select the report type as Annual Report, and set the analysis type as Waiting Duration, click the drop-down list to view the number of waiting timeout exceptions or number of people in all queues.
If you select the report type as Daily Report, Weekly Report, or Monthly Report and set the analysis type as Queue Length, click the drop-down list to view the number of people amount exceeding exceptions or queue length of different queues.
If you select the report type as Annual Report, and set the analysis type as Queue Length, the people amount exceeding exceptions will show.
Generate Queue Analysis Report
For cameras which support queue management, you can generate a report to show the number of queue exceptions and number of persons in each queue, and show the queue status including waiting duration and queue length.
Add a camera which supports queue management to the system and configure queue regions. To configure the queue region, refer to user manual of the camera.
-
Select camera(s) for statistics.
-
Click in the camera
panel.
-
Click
-
Click Generate Report.
A chart are displayed in the right panel, showing the number of exceptions (waiting timeout or people amount exceeding) of different queues.
Figure 1. Queue Analysis Report
- Optional:
Perform the following operation(s) after generating the report.
Option Description Show/Hide Certain Data
Click the legend to show or hide the data of certain element, such as queue.
View Queue Analysis Report of Single Queue
Click the queue icon on the page below to view the report of the single queue, including the number of exceptions, number of people in the queue, and waiting durations .
Switch Between Number of Exceptions, Number of People, and Queue Length
Click
on the page below to
view the report of all the selected queues.If you select the report type as Daily Report, Weekly Report, or Monthly Report, and set the analysis type as Waiting Duration, click the drop-down list to view the number of waiting timeout exceptions, or number of people in different and all queues.
If you select the report type as Annual Report, and set the analysis type as Waiting Duration, click the drop-down list to view the number of waiting timeout exceptions or number of people in all queues.
If you select the report type as Daily Report, Weekly Report, or Monthly Report and set the analysis type as Queue Length, click the drop-down list to view the number of people amount exceeding exceptions or queue length of different queues.
If you select the report type as Annual Report, and set the analysis type as Queue Length, the people amount exceeding exceptions will show.