Customize Report Dashboard
The report dashboard provides an at-a-glance view for the reports supported by the system, such as people counting report, vehicle analysis report, and queue analysis report. You can customize the report dashboard as required.
- Optional:
Add dashboard(s).
-
Click
 on the report dashboard
page to add a new dashboard.
on the report dashboard
page to add a new dashboard. -
Click
 > to add a new dashboard.
Note:You can add up to 200 dashboards.
The new dashboard appears and it is named as "Dashboard + The Time When It was Added" by default. For example, in "Dashboard20190916102436", "2019" represents year, "09" month, "16" date, "10" hour, "24" minute, and "26" second.
-
- Optional:
Edit dashboard(s).
-
Click to enter the dashboard management
page.
-
Move the cursor to the name of a dashboard, and then click
 to edit the dashboard
name, or click
to edit the dashboard
name, or click  to delete the
dashboard.
to delete the
dashboard.
- Click Back to go back to the report dashboard page.
-
Click
-
Add report(s) to a dashboard and edit the report(s).
-
Click Add to Dashboard on the report page to add
the report to dashboard.
The report appears on the selected dashboard.
And
 appears on the
lower-right of the report dashboard page. You can click the icon to
add more reports.
appears on the
lower-right of the report dashboard page. You can click the icon to
add more reports. -
Perform the following operations.
-
Add More Reports: Click
to add more
reports to the dashboard. -
View Report in Larger Window: Click
 to view the
report in larger window.
to view the
report in larger window. -
Edit Report Name: Click
 and then
click Edit Name.
and then
click Edit Name. -
Delete Report from Dashboard: Click
and then
click Delete.
-
Figure 1. Report Dashboard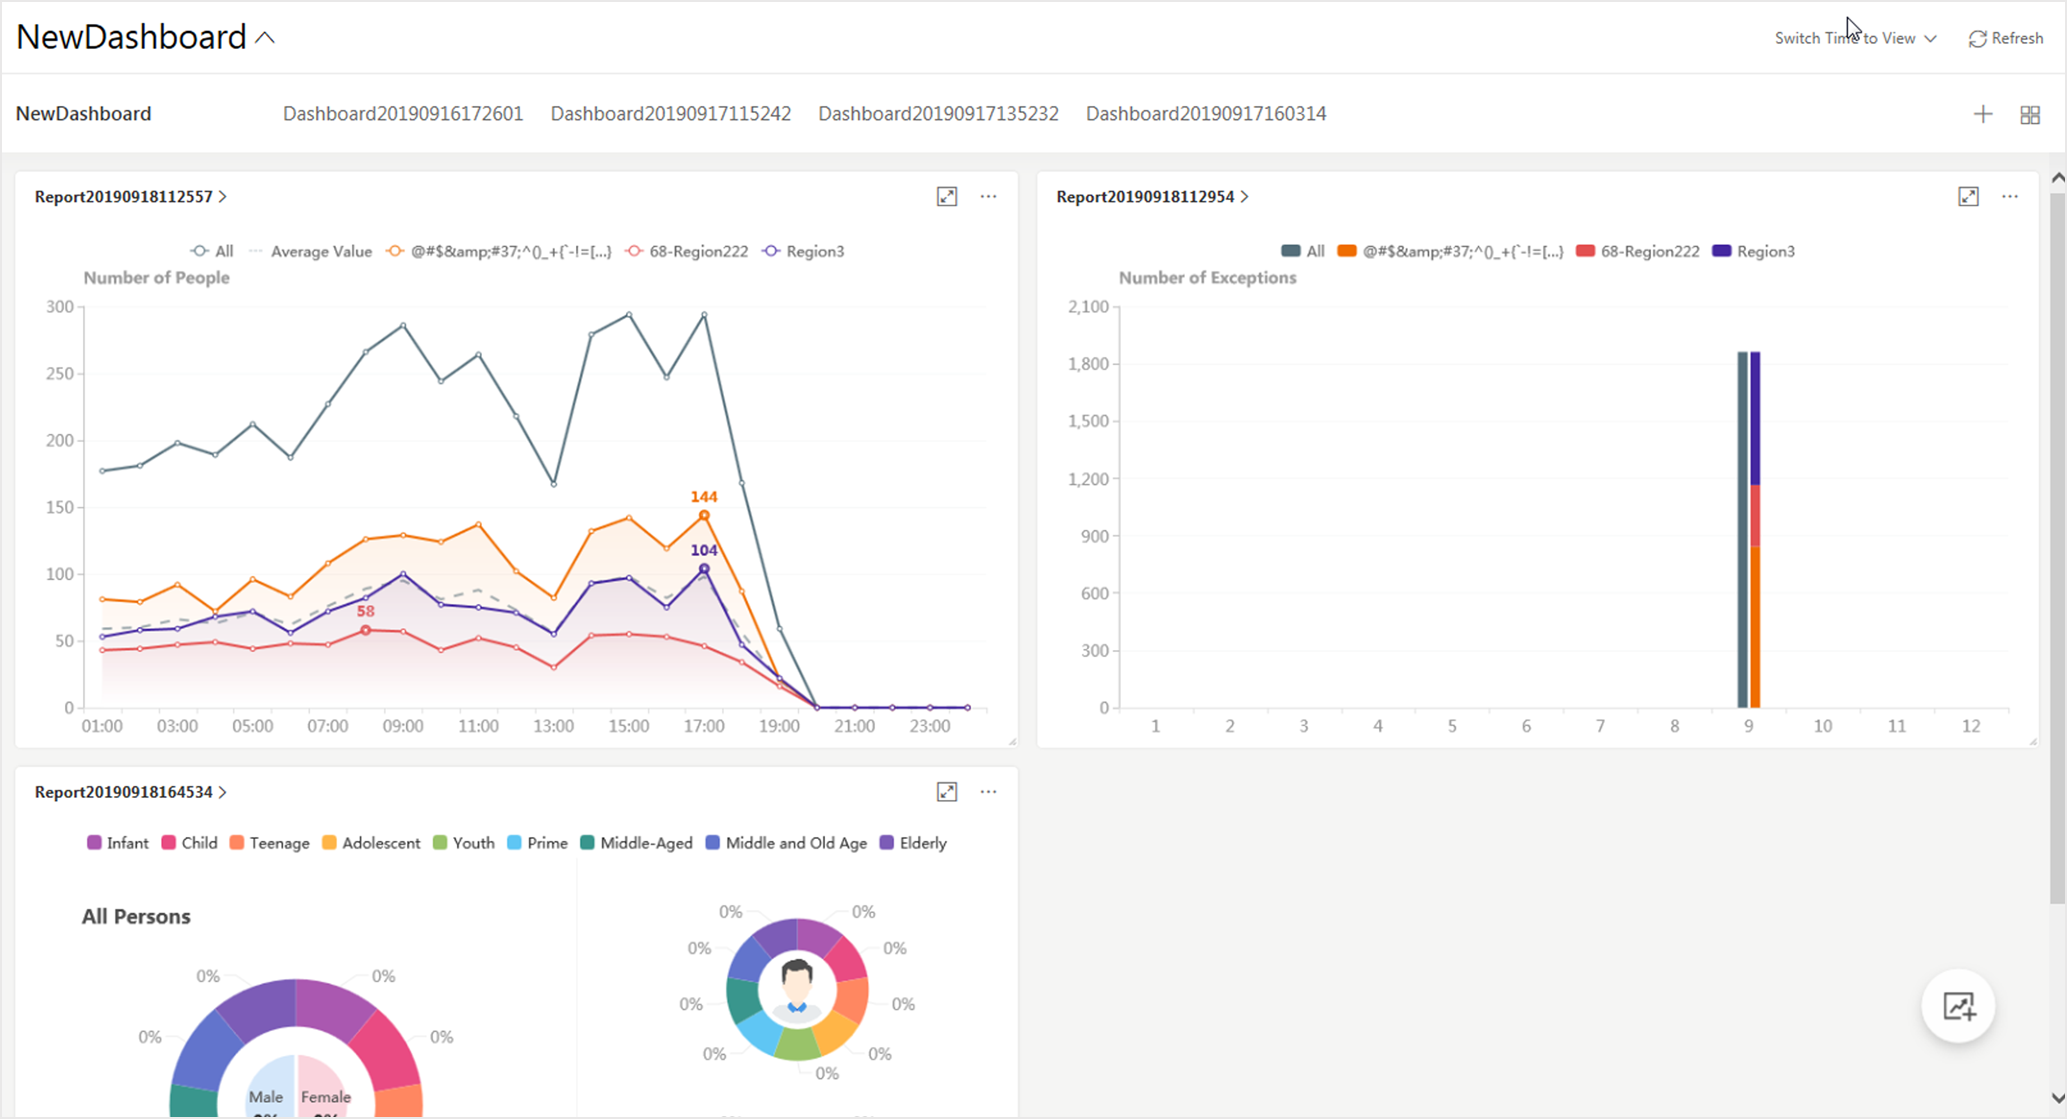
-
Click Add to Dashboard on the report page to add
the report to dashboard.
-
Switch time to view report data.
- Select a dashboard and then click Switch Time to View to set the report type and time.
 to
specify a time interval for generating report data.
to
specify a time interval for generating report data.Customize Report Dashboard
The report dashboard provides an at-a-glance view for the reports supported by the system, such as people counting report, vehicle analysis report, and queue analysis report. You can customize the report dashboard as required.
- Optional:
Add dashboard(s).
-
Click
on the report dashboard
page to add a new dashboard. -
Click
> to add a new dashboard.
Note:You can add up to 200 dashboards.
The new dashboard appears and it is named as "Dashboard + The Time When It was Added" by default. For example, in "Dashboard20190916102436", "2019" represents year, "09" month, "16" date, "10" hour, "24" minute, and "26" second.
-
- Optional:
Edit dashboard(s).
-
Click to enter the dashboard management
page.
-
Move the cursor to the name of a dashboard, and then click to edit the dashboard
name, or click to delete the
dashboard.
- Click Back to go back to the report dashboard page.
-
Click
-
Add report(s) to a dashboard and edit the report(s).
-
Click Add to Dashboard on the report page to add
the report to dashboard.
The report appears on the selected dashboard.
And
appears on the
lower-right of the report dashboard page. You can click the icon to
add more reports. -
Perform the following operations.
-
Add More Reports: Click
to add more
reports to the dashboard. -
View Report in Larger Window: Click
to view the
report in larger window. -
Edit Report Name: Click
and then
click Edit Name. -
Delete Report from Dashboard: Click
and then
click Delete.
-
Figure 1. Report Dashboard
-
Click Add to Dashboard on the report page to add
the report to dashboard.
-
Switch time to view report data.
- Select a dashboard and then click Switch Time to View to set the report type and time.