Generate Skin-surface Temperature Analysis Report
You can generate skin-surface temperature analysis report to view the variation trend of the number people whose skin-surface temperatures are abnormal.
-
Make sure you have added devices that support temperature screening to HikCentral Professional.
-
Make sure you have enabled temperature screening on the device. For details, see the user manual of the device.
-
Click Intelligent Analysis >
 Skin-surface Temperature
Analysis to enter the Skin-surface Temperature Analysis page.
Skin-surface Temperature
Analysis to enter the Skin-surface Temperature Analysis page.
-
Select temperature screening point(s) or person group(s) based on the analysis
type you set in the previous step.
-
Click
 to open
the
camera list panel
or
person group panel.
to open
the
camera list panel
or
person group panel.
-
Click
-
Click Generate Report.
The statistics of the selected item(s) will be displayed.
Figure 1. Skin-surface Temperature Analysis Report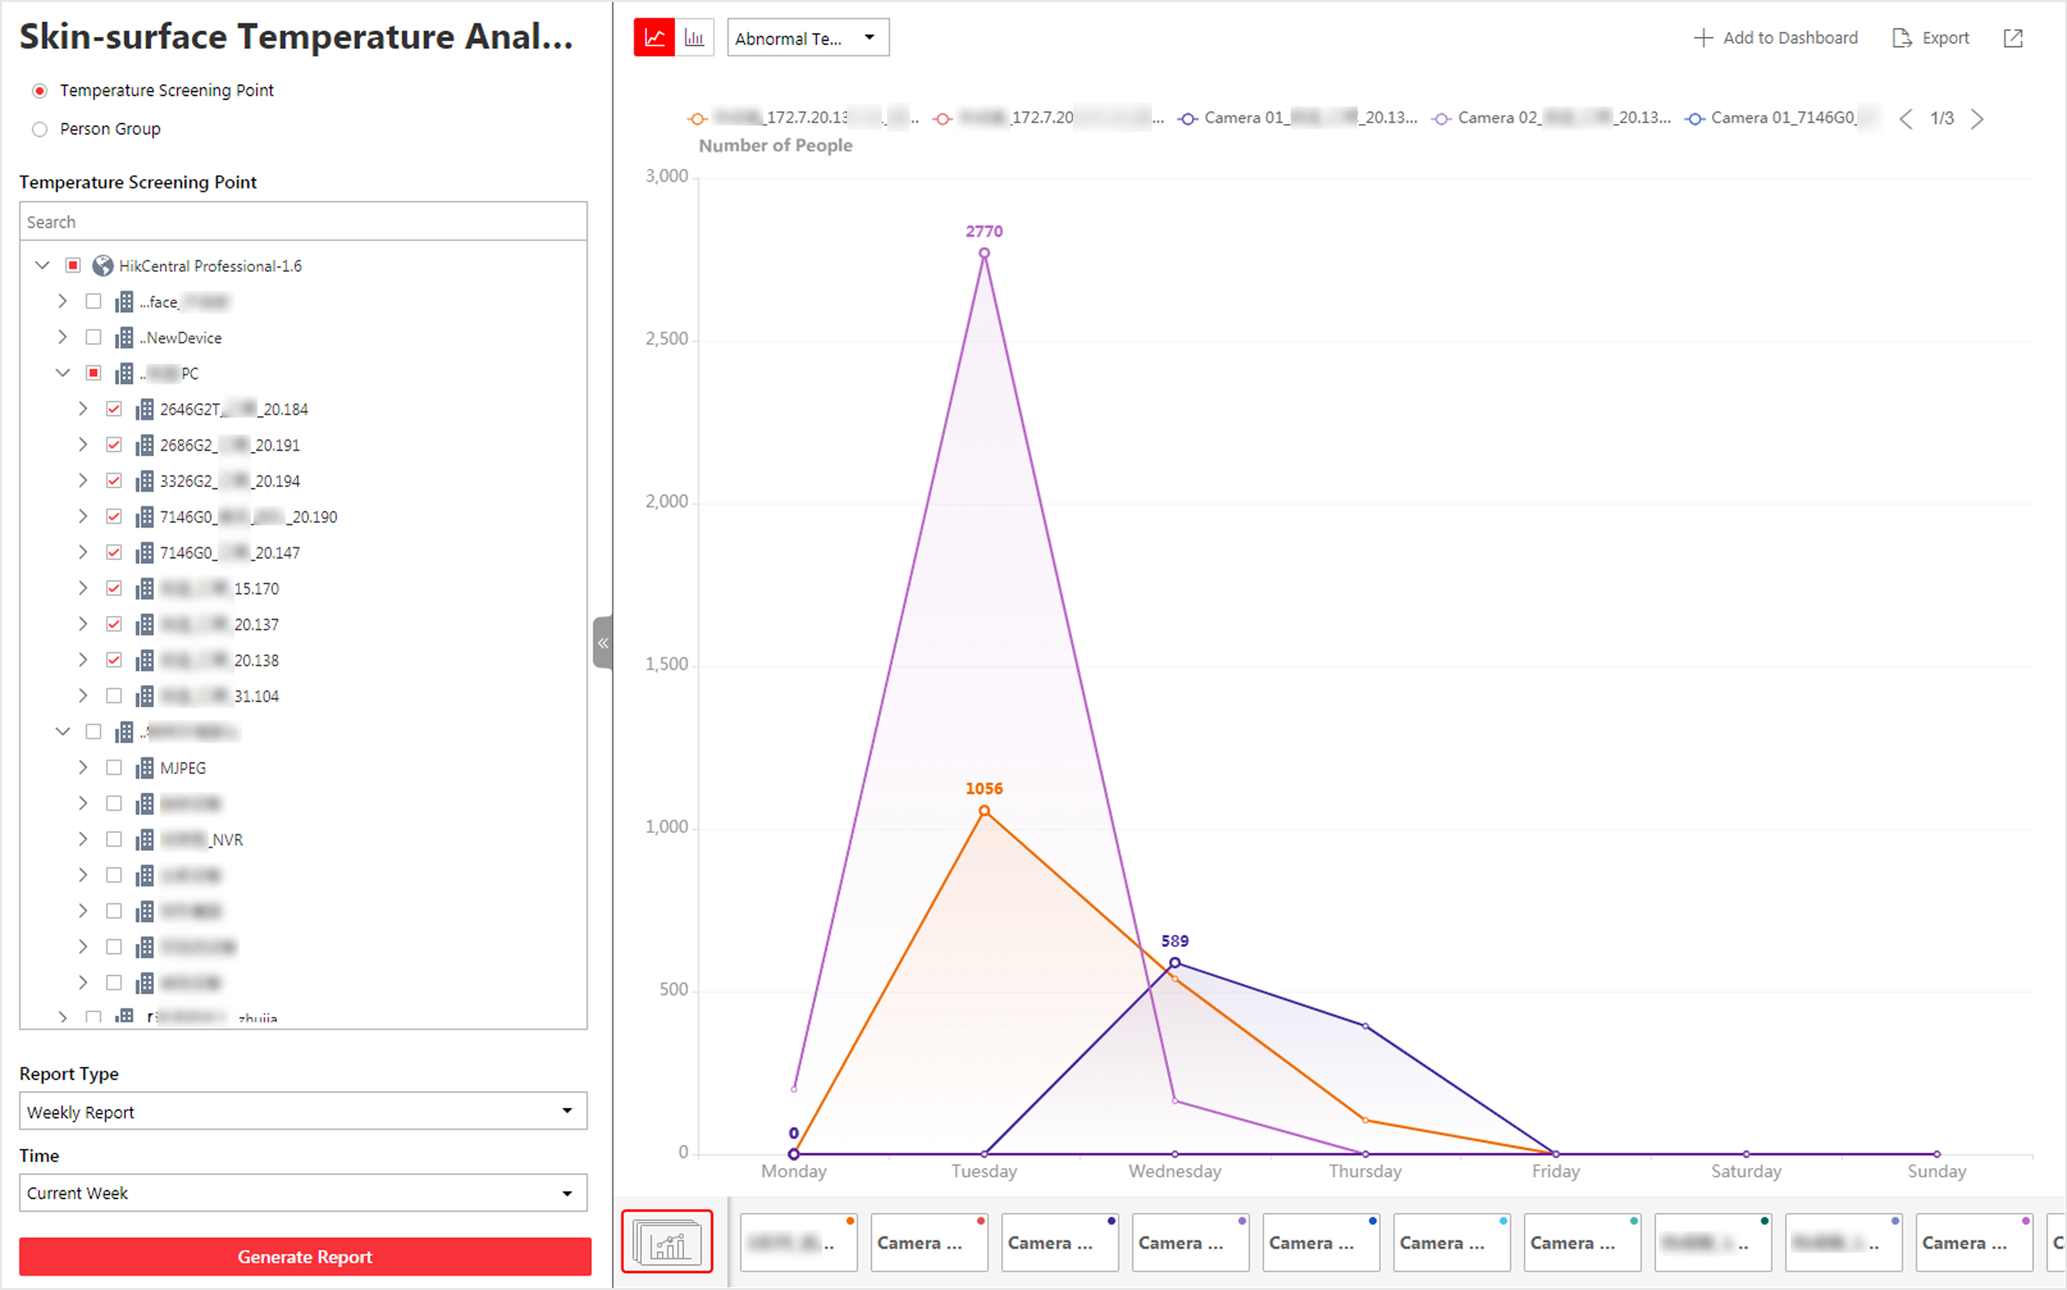
- Optional:
Perform the following operations if required.
Option Description Show/Hide Certain Data
Click the legend to show or hide the data of certain element, such as certain camera.
Switch Between Line Chart and Histogram
Click
 /
/ to switch between
line chart and histogram.Note:
to switch between
line chart and histogram.Note:Daily report only supports histogram.
Add a Report to Dashboard
-
Click Add to Dashboard in the upper-right corner of the page.
-
Create a report name.
-
Select a dashboard. Or click New to create a new board and then select it.
-
Click Add or Add and Go to Dashboard.
-
Generate Skin-surface Temperature Analysis Report
You can generate skin-surface temperature analysis report to view the variation trend of the number people whose skin-surface temperatures are abnormal.
-
Make sure you have added devices that support temperature screening to HikCentral Professional.
-
Make sure you have enabled temperature screening on the device. For details, see the user manual of the device.
-
Click Intelligent Analysis > Skin-surface Temperature
Analysis to enter the Skin-surface Temperature Analysis page.
-
Select temperature screening point(s) or person group(s) based on the analysis
type you set in the previous step.
-
Click to open
the
camera list panel
or
person group panel.
-
Click
-
Click Generate Report.
The statistics of the selected item(s) will be displayed.
Figure 1. Skin-surface Temperature Analysis Report
- Optional:
Perform the following operations if required.
Option Description Show/Hide Certain Data
Click the legend to show or hide the data of certain element, such as certain camera.
Switch Between Line Chart and Histogram
Click
/ to switch between
line chart and histogram.Note:Daily report only supports histogram.
Add a Report to Dashboard
-
Click Add to Dashboard in the upper-right corner of the page.
-
Create a report name.
-
Select a dashboard. Or click New to create a new board and then select it.
-
Click Add or Add and Go to Dashboard.
-