Flow Chart of Intelligent Analysis Report in Public Scenario
The following flow chart shows the process of configurations and operations required for intelligent analysis reports in public scenario.
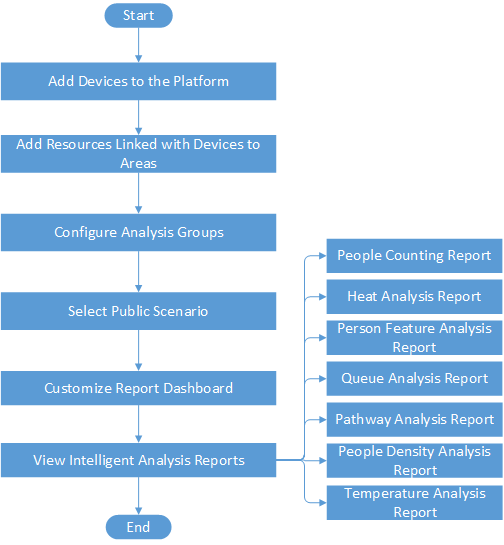 Figure 1 Flow Chart of Intelligent Analysis
Report in Public Scenario
Figure 1 Flow Chart of Intelligent Analysis
Report in Public Scenario|
Procedure |
Description |
|---|---|
|
Add Devices to the Platform |
Add devices that support specific detection functions to the platform by different methods (e.g., online detection, IP address, port segment, device ID) for generating statistics reports. For details, see Device and Server Management. |
|
Add Resources Linked with Devices to Areas |
Group resources linked with devices to different areas according to the locations of the devices for convenient management. For details, see Add Element to Area. |
|
Configure Analysis Groups |
Group analysis resources of certain regions for calculation. For details, see Add People Counting Group, Add Heat Analysis Group, Add Person Feature Analysis Group, and Add Pathway Analysis Group. |
|
Select Public Scenario |
In the non-store scenario (e.g., subway, square), you can view reports collected from an analysis group or camera about people counting, person features, heat data, etc. For details, see Configure Scenario. |
|
Customize Report Dashboard |
Customize a report dashboard for an at-a-glance view for the public scenario reports. For details, see Customize Report Dashboard. |
|
View Intelligent Analysis Reports |
View people counting reports, person feature analysis reports, heat analysis reports, pathway analysis reports, queue analysis reports, people density analysis reports, and temperature analysis reports. For details, see View Intelligent Analysis Report. |