Export Operation Reports of Parking Lots

You can view the statistics related to the operations of parking lots, such as real-time parking space statistics, parking space occupancy rate and times, parking duration distribution, and traffic flow. The statistics can give you a general picture of the operation situation of parking lots.

  1. On the top navigation bar, select > Passing Management > Parking Lot > Statistics and Reports > Operation Report.
  2. In the top right corner of the Operation Report page, click Set Statistics Type and select the types of statistics to be displayed below for the parking lot(s).
    Note:
    • Any user with the permission to view the parking lot operation is able to set which types of statistics to display on the page.

    • All users share a common configuration.

  3. Select a report type from Day, Month, and Year, or click Custom to customize a time period for generating the operation data.
  4. View statistics of all parking lots by default or select a parking lot from the drop-down list to view statistics of a specific parking lot.
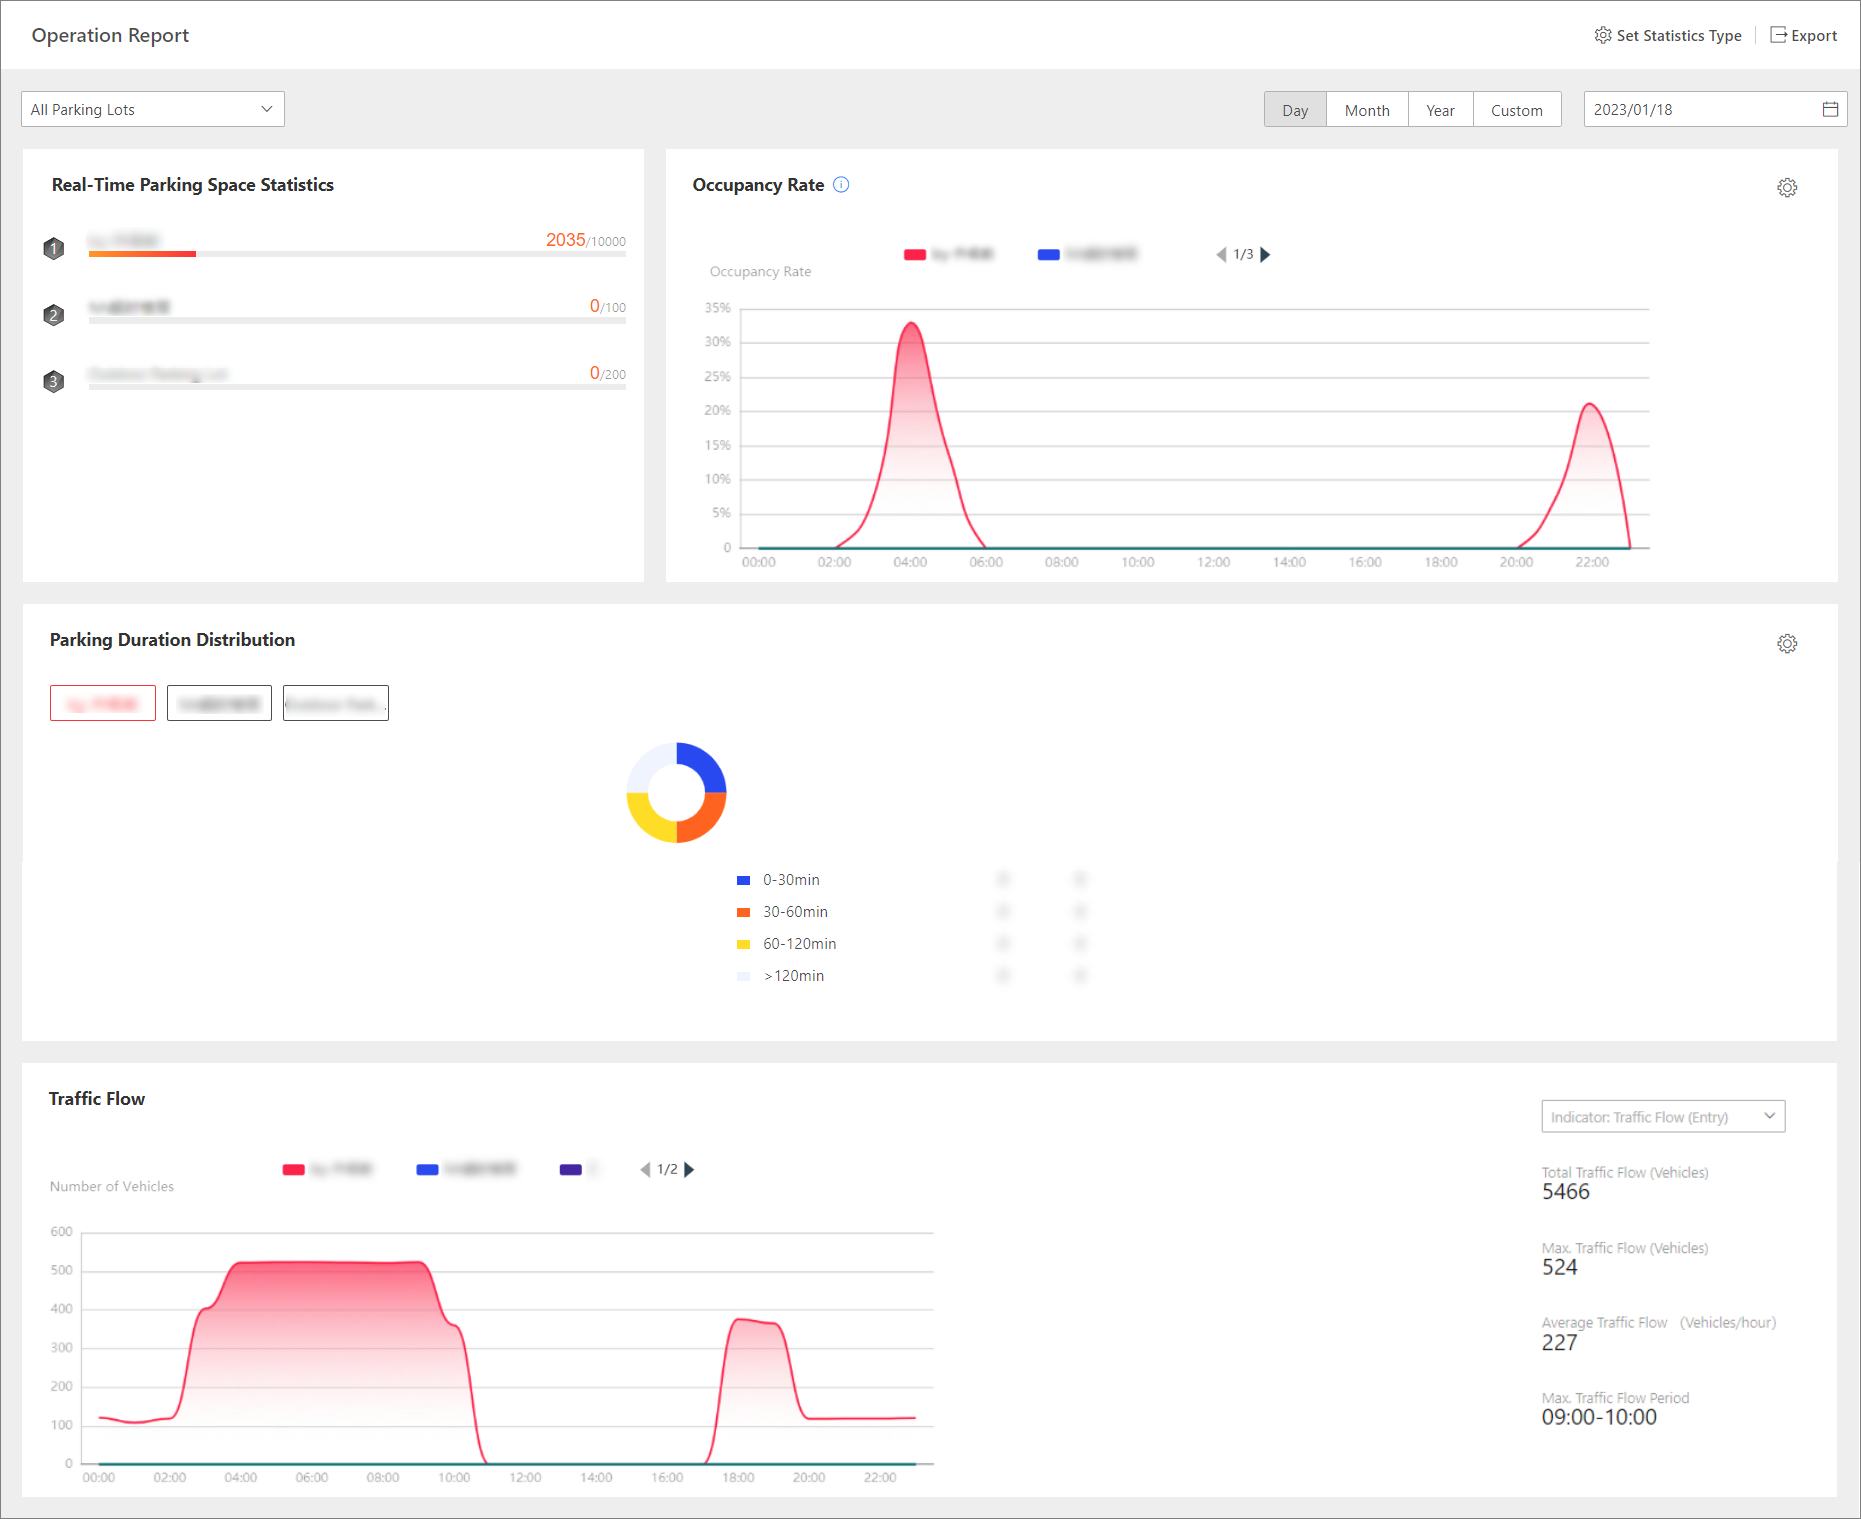
    Figure 1 Operation Report of All Parking Lots
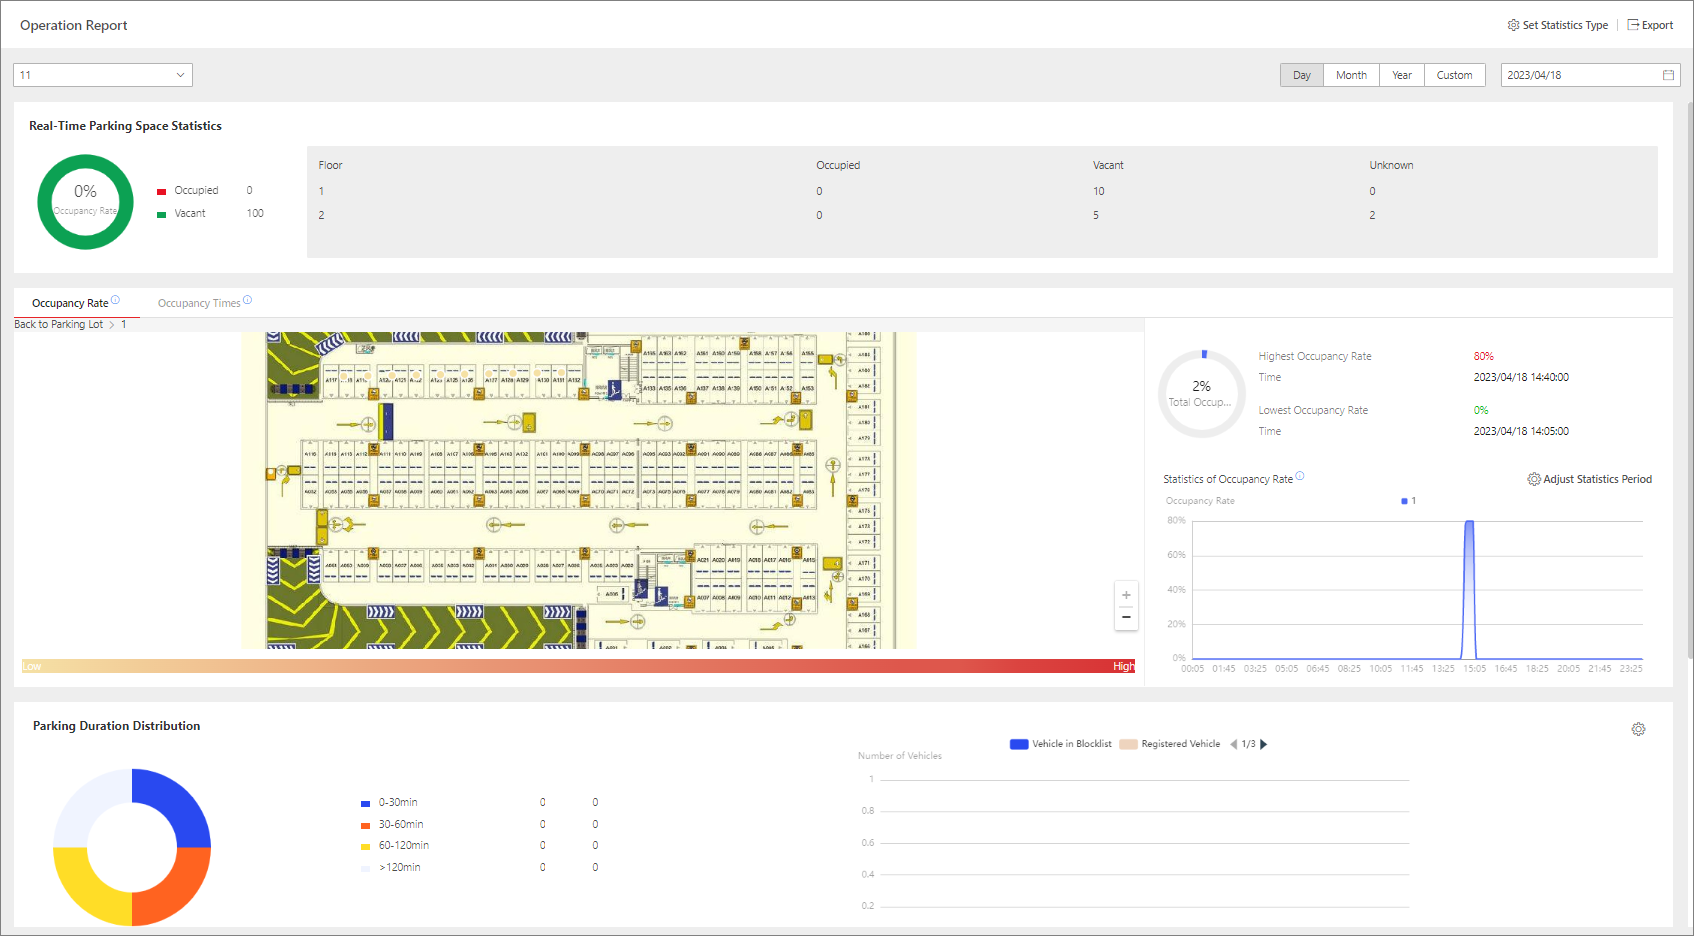
    Table 1 Operation Report of All Parking Lots

    Statistics Type

    Description

    Real-Time Parking Space Statistics

    Display the real-time numbers of occupied and total parking spaces in each parking lot.

    Occupancy Rate

    Click to set a time period. The statistics generated in the set period will be displayed.

    Parking Duration Distribution

    Click to set the parking duration(s) to be calculated.

    The distribution of the selected parking duration(s) will be displayed.

    Click tabs above the pie chart to switch among parking lots for viewing the corresponding distribution.

    Traffic Flow

    In the top right corner of the area, select one or multiple indicators from the drop-down list.

    Traffic Flow (Entry)

    The total number of vehicles entered all parking lots.

    Traffic Flow (Exit)

    The total number of vehicles exited all parking lots.

    Note:

    If the user only has permissions related to parking guidance, there will be no drop-down list in this area used for selecting indicators.

    Figure 2 Operation Report of a Parking Lot
    Table 2 Operation Report of a Parking Lot

    Statistics Type

    Description

    Real-Time Parking Space Statistics

    Display the real-time numbers of occupied/vacant parking spaces in the parking lot and numbers of occupied/vacant/unknown parking spaces on each floor of the parking lot.

    Occupancy Rate

    Click Adjust Time Period at the right to set a time period.

    The map on each floor of the parking lot will be displayed, and you can click the map to enlarge it for viewing. The parking space icons on the map are marked with different colors that indicate different occupancy rates. The deeper the color, the higher the occupancy rate of the parking space during the selected time.

    The statistics generated in the set time period, including the total occupancy rate of the parking lot, the maximum/minimum occupancy rate, the corresponding happening time, and the occupancy rate of each floor or parking space type, will be displayed.

    Occupancy Times

    The report of occupancy times indicates the exposure rates of areas in the parking lot, which can help the parking lot manager to determine whether to place advertisements.

    Click Adjust Time Period at the right to set a time period.

    The map on each floor of the parking lot will be displayed, and you can click the map to enlarge it for viewing. The parking space icons on the map are marked with different colors that indicate different occupancy times. The deeper the color, the more times the parking space is taken up during the selected time period.

    The statistics generated in the set time period, including the total occupancy times of the parking lot, the maximum/minimum occupancy times, the corresponding parking floors, and the occupancy times of each floor, will be displayed.

    Parking Duration Distribution

    Click to set the parking duration(s) to be calculated.

    The distribution of the selected parking duration(s) will be displayed in a pie chart.

    The number(s) of vehicles with the selected parking duration(s) will be displayed by vehicle lists.

    Traffic Flow

    In the top right corner of the area, select one or multiple indicators from the drop-down list.

    Traffic Flow (Entry)

    The number of vehicles that entered the parking lots.

    Traffic Flow (Exit)

    The number of vehicles that exited the parking lots.

    By: Entrance and Exit

    If only one indicator is selected, you can select the entrance(s) and exits(s) for displaying the traffic flow by entrance and exit.

    By: Vehicle List

    If only one indicator is selected, you can select the vehicle list(s) for displaying the traffic flow by vehicle list.

    Note:

    If the user only has permissions related to parking guidance, there will be no drop-down list in this area used for selecting indicators.

  5. Optional: In the upper-right corner, click Export, select Excel or CSV as the format of the exported data file(s), and click Save to download the report and the detailed statistics to the local PC.
    Note:

    The entire operation report will be saved as a PDF files by default. For the operation report of a parking lot, the floor map(s) containing the parking space occupancy information will also be saved as the PDF file(s) named by the floor name(s) by default. Other than the report, each type of statistics will be individually exported in the format you selected.