Historical Health Data Overview
You can view the historical online rate of resources and devices, or the recording integrity rate.
On the top, select  > Basic Management > Maintenance.
Select on the left.
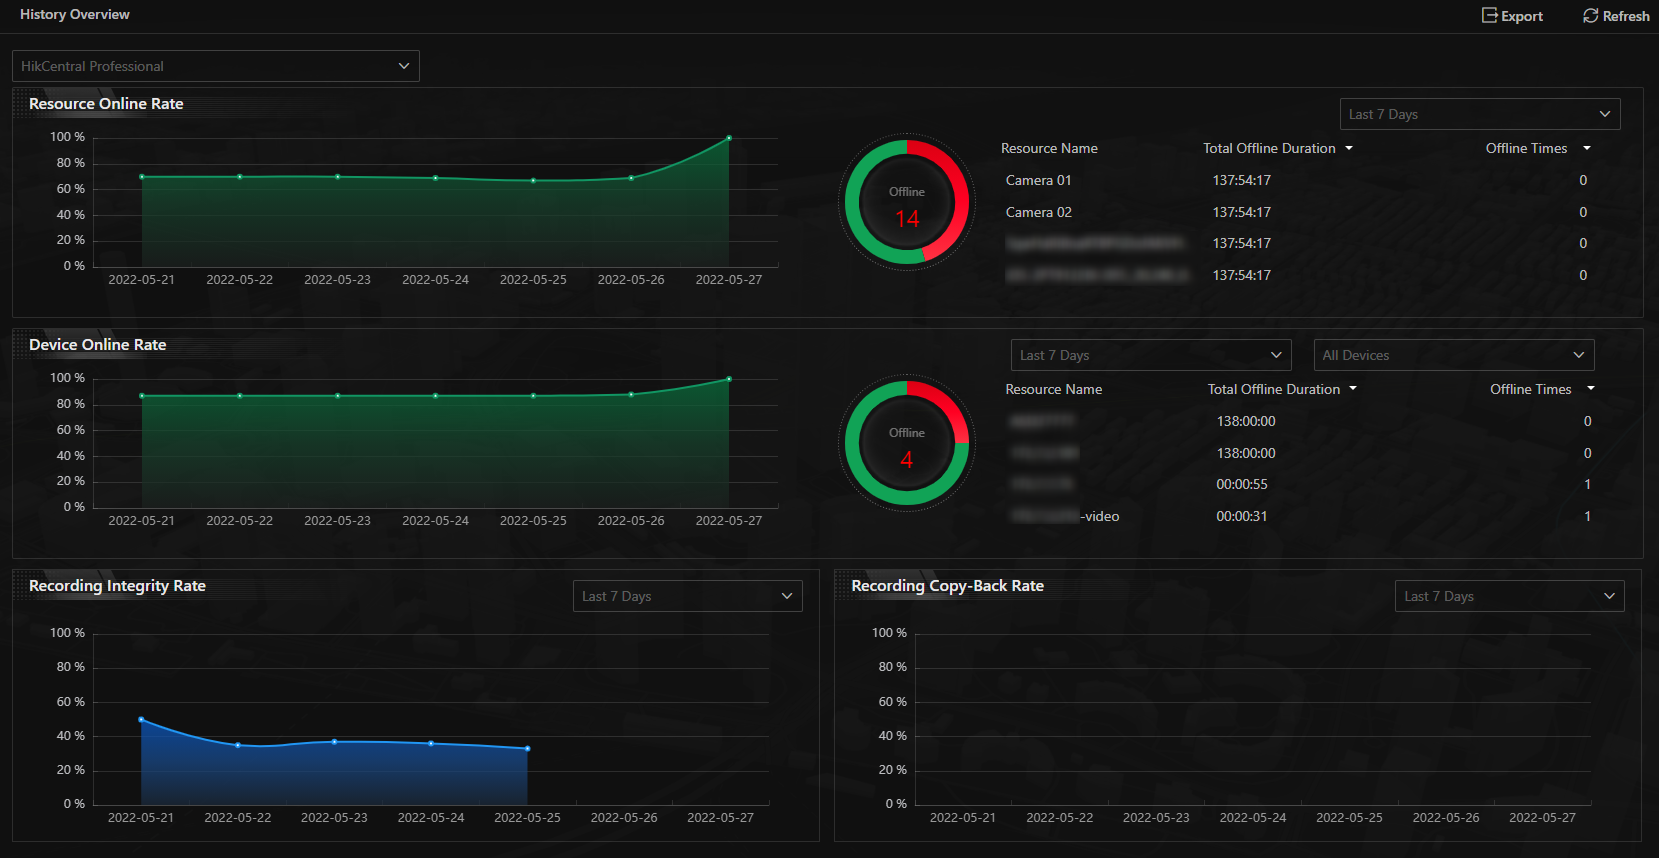 Figure 1 Historical Health Data
Overview
Figure 1 Historical Health Data
Overview|
Section |
Description |
|---|---|
|
Filter Data |
Select a time period from the drop-down list in the upper right corner of each section for filtering data by day, week, or month. |
|
Resource Online Rate |
|
|
Device Online Rate |
|
|
Recording Integrity Rate |
On the line chart, you can move the cursor to view the recording integrity rate at specific time points. Click the a dot on the line to go to Resource Log page to view the detailed resource status of devices at that time point. |
|
Recording Copy-Back Rate |
On the line chart, you can move the cursor to view the recording callback rate at specific time points. Click a dot on the line to go to Resource Log page to view the detailed resource status of devices at that time point. |
|
Select Site |
In the upper left corner of History Overview page, select a Current or Remote Site from the drop-down list to display the historical data of resources on the Site. |
|
Refresh |
|
|
Export Overview Page or Exception Data |
Click Export in the upper right corner of History Overview page to export the page in PDF format. Or you can check Export Exception Data to export the exception data in Excel/CSV format. 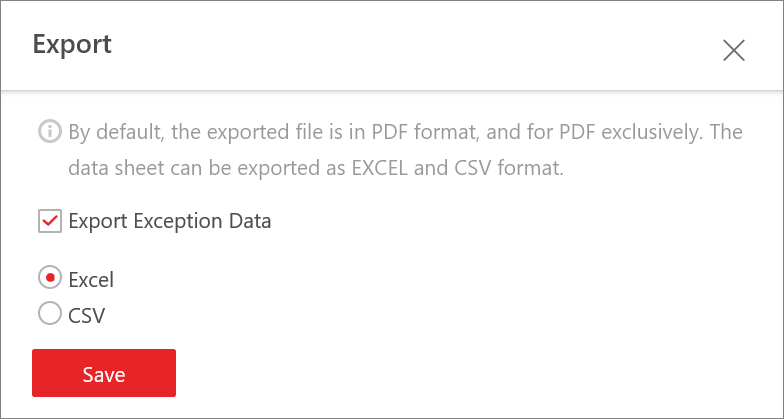 Figure 2 Export
Overview Page or Exception Data
Figure 2 Export
Overview Page or Exception Data |