Real-Time Health Status Overview
In the Health Monitoring module, you can view the real-time health status of the devices, servers, and resources managed on the platform. If there is no network transmission devices added, the Real-Time Overview page provides an at-a-glance view of the health status with charts and basic data of resource status.
On the top, select  > Basic Management > Maintenance.
Select on the left.
Click Real-Time Overview tab at the top to enter the Real-Time Overview page.
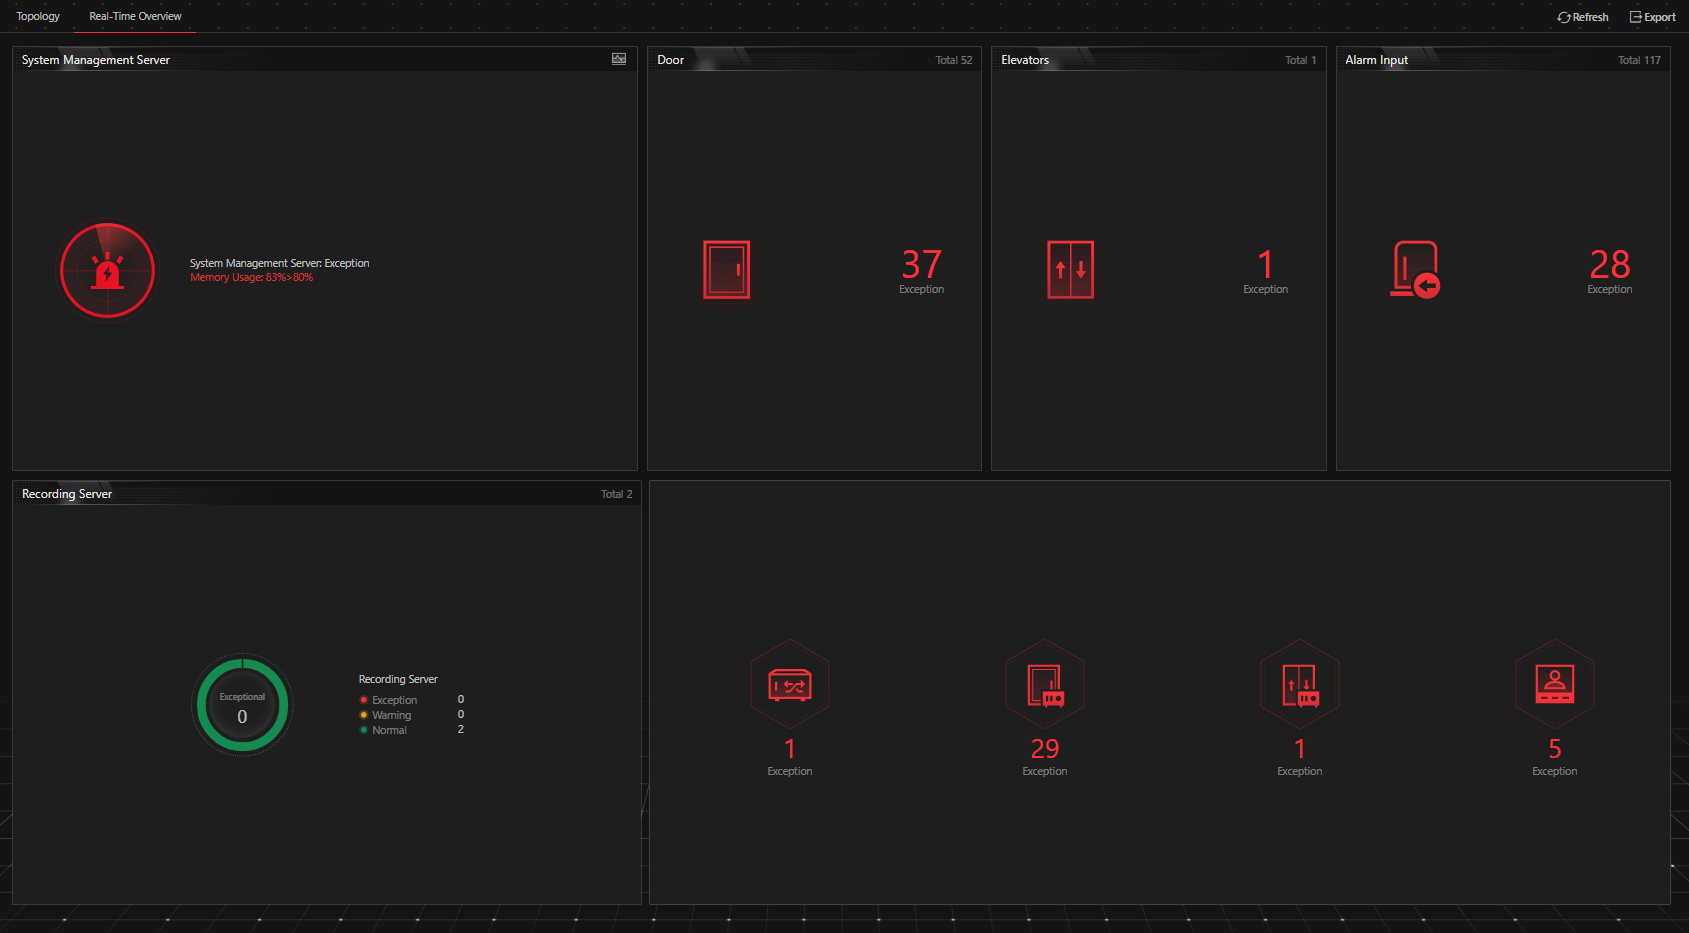 Figure 1 Real-Time Health Status
Overview
Figure 1 Real-Time Health Status
Overview|
Section |
Description |
|---|---|
|
Resource Status |
View the abnormal data of different resources (e.g., cameras, doors, elevators, or alarm inputs) added to the areas of Central System in the graphical way. You can click the numbers and status types on the chart to view the real-time status details of resources or Remote Sites. Note:
The Remote Site status is only available for the Central System with Remote Site Management module (based on the License you purchased). |
|
System Management Server Status |
View the network health status and server running status.
Click 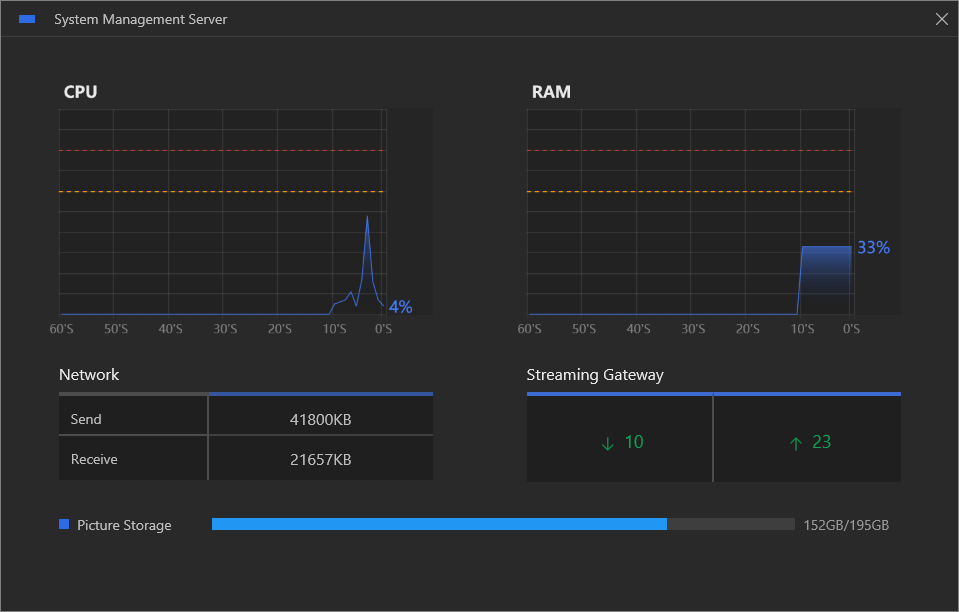 Figure 2 System
Management Server Status Details
Figure 2 System
Management Server Status Details |
|
Server Status |
View the status (i.e., exception, warning, normal) of servers added on Central System. You can click the numbers and status types on the chart to view the real-time status details of servers. |
|
Device Status |
View the abnormal data of different devices added on Central System. You can click the numbers on the chart to view the real-time status details of devices. If the icon |
|
Select Sites |
Select one or multiple Sites (including Remote Sites) from the drop-down list in the upper left corner of Real-Time Overview page to display the status of resources on the selected Site(s). |
|
Refresh |
|
|
Export Overview Page or Exception Data |
Click Export in the upper right corner of Real-Time Overview page to export the page in PDF format. Or you can check Export Exception Data to export the exception data in Excel/CSV format. 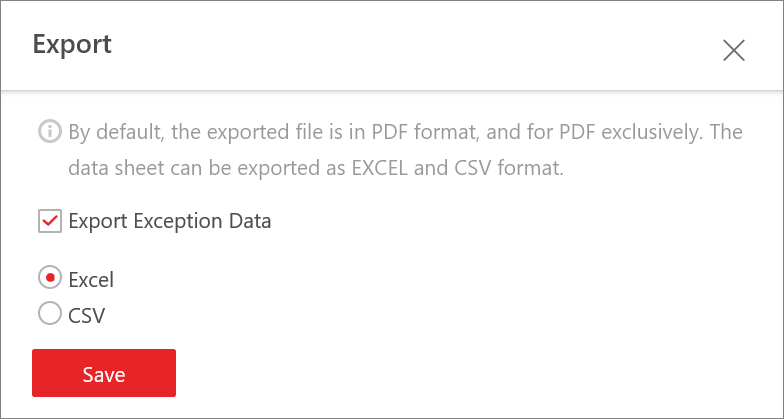 Figure 3 Export
Overview Page or Exception Data
Figure 3 Export
Overview Page or Exception Data |
 in the upper right
corner of System Management Server panel to view the running status
details of the server, including CPU usage, RAM usage, etc.
in the upper right
corner of System Management Server panel to view the running status
details of the server, including CPU usage, RAM usage, etc. appears at the top of device picture,
it indicates that the device firmware should be upgraded.
appears at the top of device picture,
it indicates that the device firmware should be upgraded.