You can generate a people counting report which displays the period over
period data and trend of people counting statistics to have a direct view of people
entering, exiting, passing by, and walk-in rate. You can also export the report to the local
PC.
Make sure you have properly configured the camera with a people counting
rule for the required area. To configure the people counting rule, refer to the user
manual of people counting camera.
-
In the top left corner of the platform,
select .
-
Select the report data resource type.
- Camera
-
A people counting report based on the data from the
cameras you select will be generated. You can compare the data
of different cameras.
- Analysis Group
-
A people counting report based on the data from the
people counting groups you select will be generated. You can
compare the data of different groups.
-
Select people counting camera(s) or people counting group(s) based on the data
resource type you set in the previous step.
Note:
Up to 20 cameras/groups can be selected.
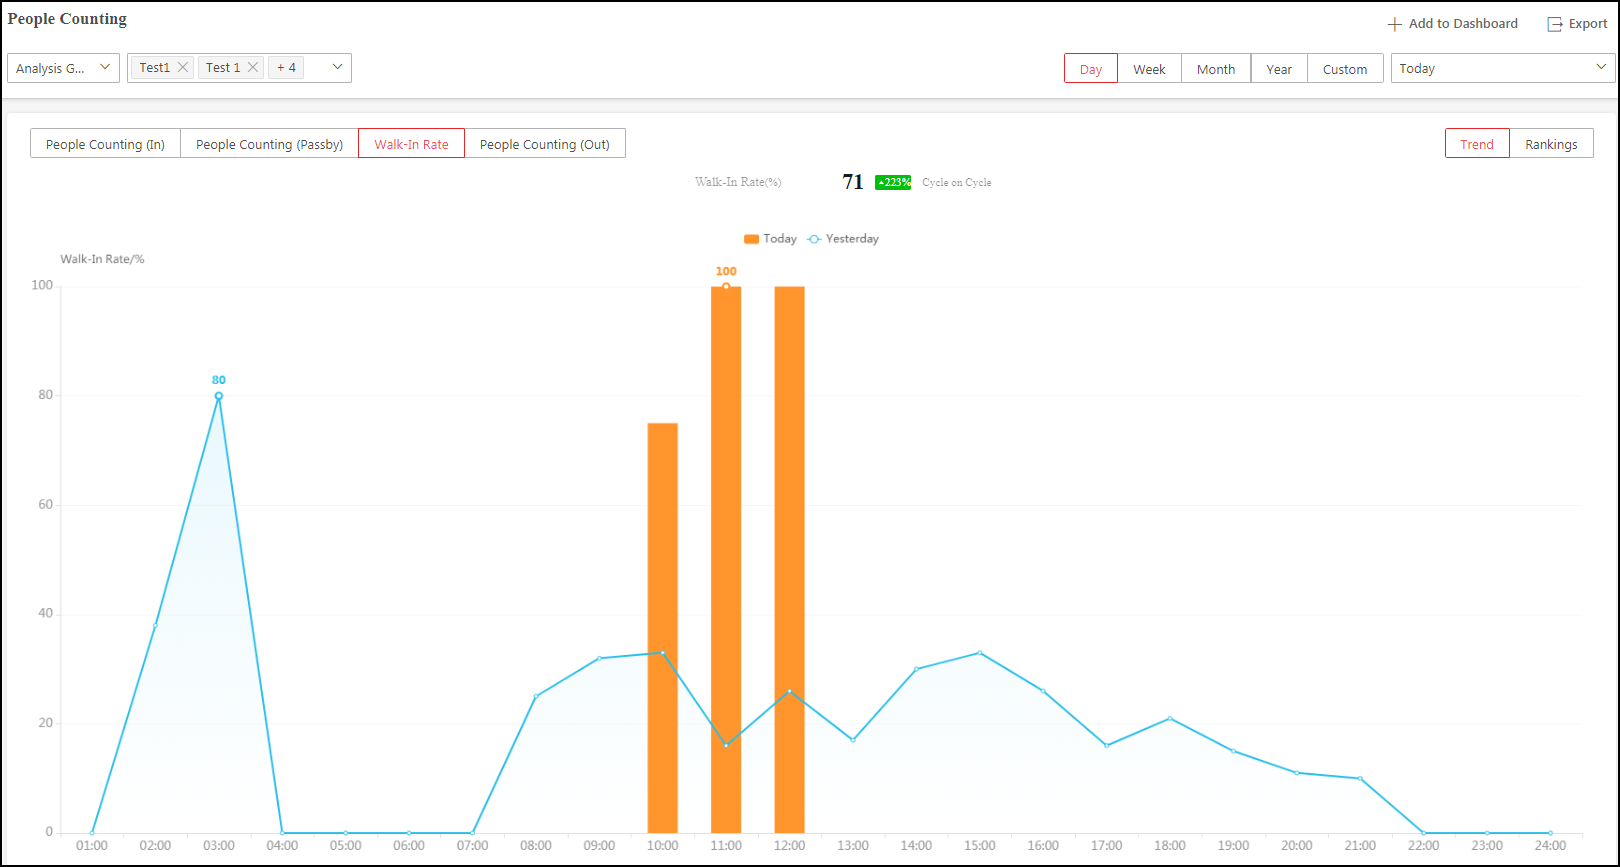 Figure 1 People Counting Report
The corresponding report of selected camera(s)/group(s) is displayed.
-
Set the statistical cycle as Day,
Week, Month,
Year, or Custom.
- Daily Report
-
Daily report shows data on a daily basis. The
platform will display the people counting data detected in each
hour of two adjacent days.
- Weekly Report, Monthly Report, and Annual Report
-
As compared to daily report, weekly report, monthly
report, and annual report can be less time-consuming, since they
are not to be submitted every day. The platform will display the
people counting data detected in each day of two adjacent weeks,
in each day of two adjacent months, and in each month of two
adjacent years.
-
Select a pre-defined time period or customize a time period for
statistics.
Note:
For custom time interval report, you need to set the start
time and end time to specify the time period.
- Optional:
Perform the following operation(s) after generating the people counting
report.
| Option |
Description |
|---|
|
Switch Between Trend Report and Rankings Report
|
Note:
It is invalid when you select only one camera/group.
Click Trend or Rankings
on the upper-right corner to switch between trend report (displaying
the trend of people counting statistics at different time) and
rankings report (displaying the statistics of different
cameras/groups for comparison).
|
|
Add to Dashboard
|
-
Click Add to Dashboard in
the upper-right corner of the page.
-
Create a report name.
-
Select a dashboard. Or click
New to create a new board and
then select it.
-
Click OK or
Add and Go to Dashboard.
|
|
Export Report
|
-
Click Export.
-
Set the format of the exported file as Excel,
CSV, or PDF.
-
Select the time dimension as By
Hour, By Day, or
By Month.
-
Click Export.
|
 > Intelligent Analysis > Report > People Counting.