View Store Intelligent Analysis Report
In the retail/supermarket scenario, to view intelligent analysis reports including people counting analysis, person feature, heat analysis, pathway analysis, and queue analysis, you should configure store(s) and add them to the platform in advance.
-
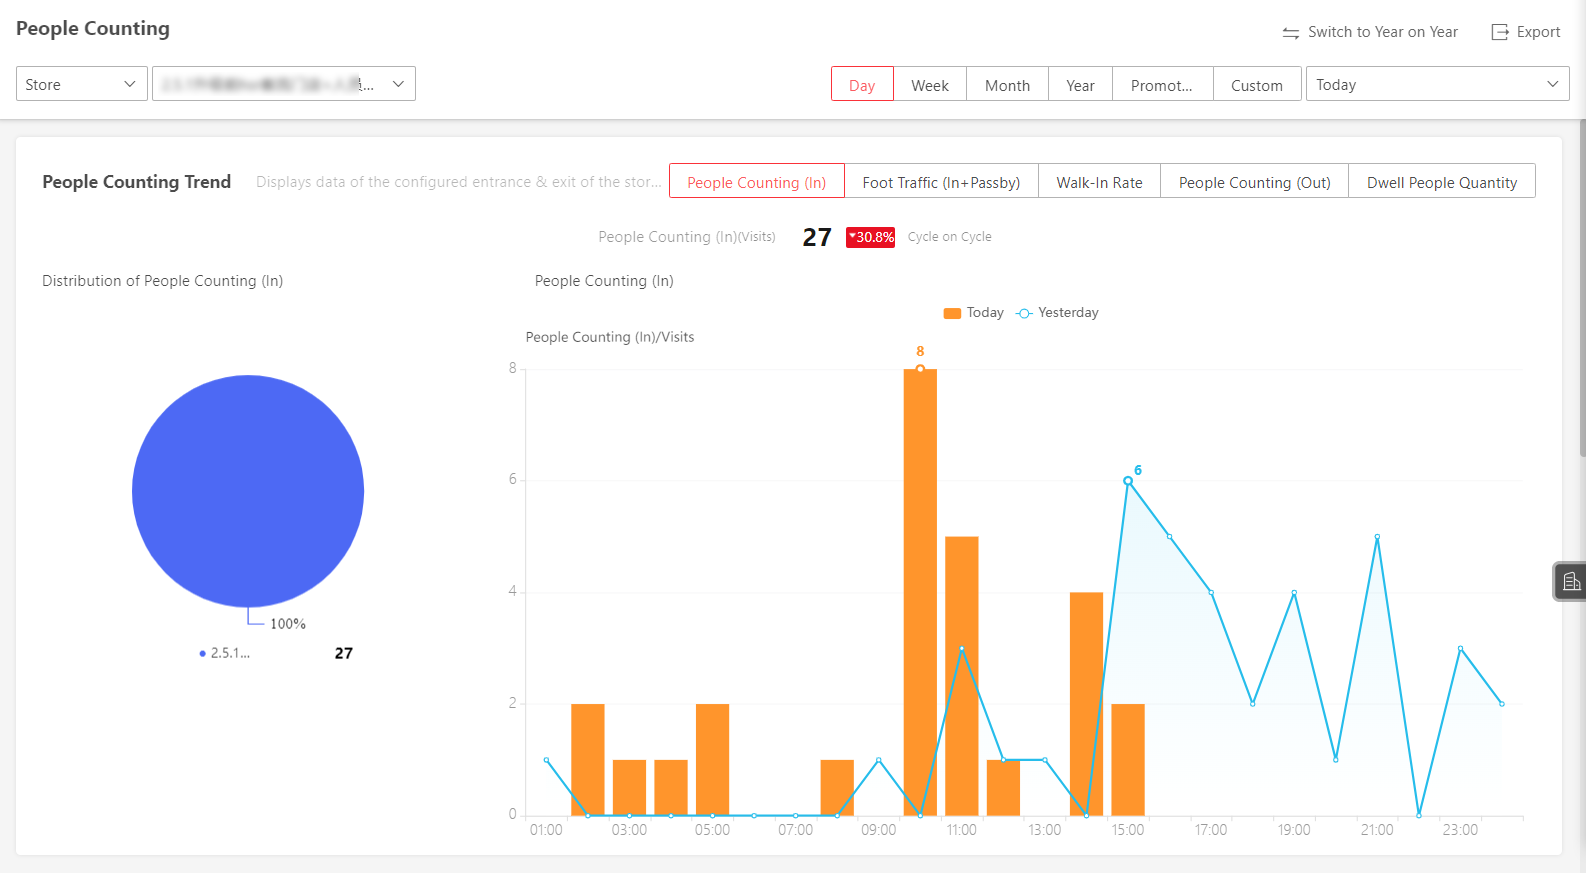
Store People Counting Report: You can generate a people counting report which displays the period over period data and trend of people counting statistics to have a direct view of people entering, exiting, passing by, and walk-in rate. You can also export the report to the local PC.
Figure 1 Store People Counting Report -
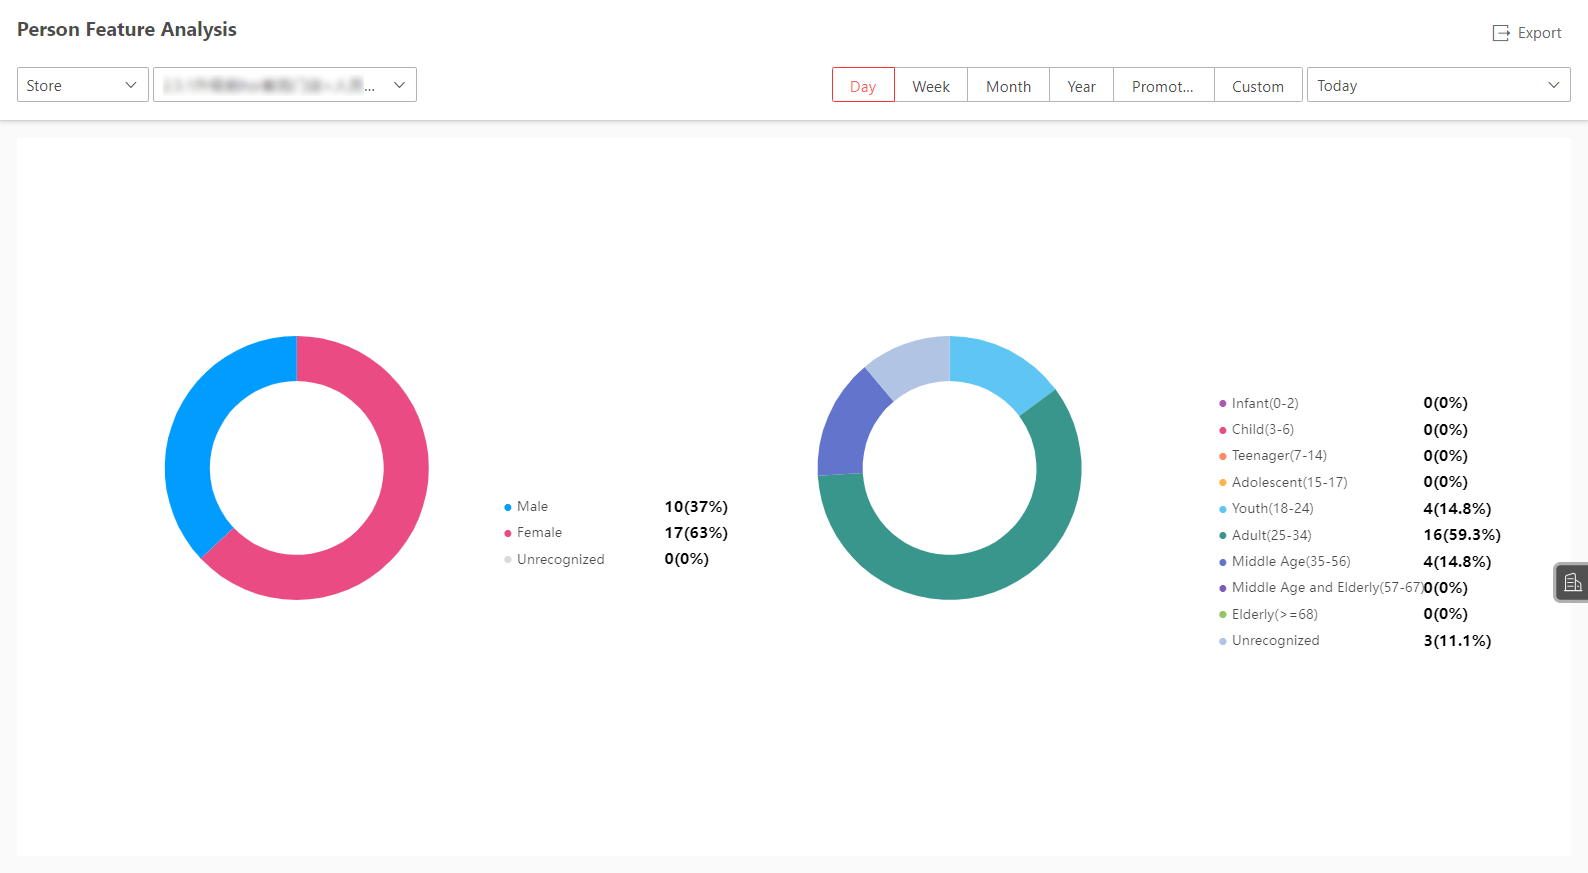
Store Person Feature Analysis Report: The platform supports saving features of recognized human faces and generating reports in various time periods. The reports tells the percentage and number of people of different features in different time period. It can be used in places such as shopping mall to analyze interests of people in different features.
Figure 2 Store Person Feature Analysis Report -
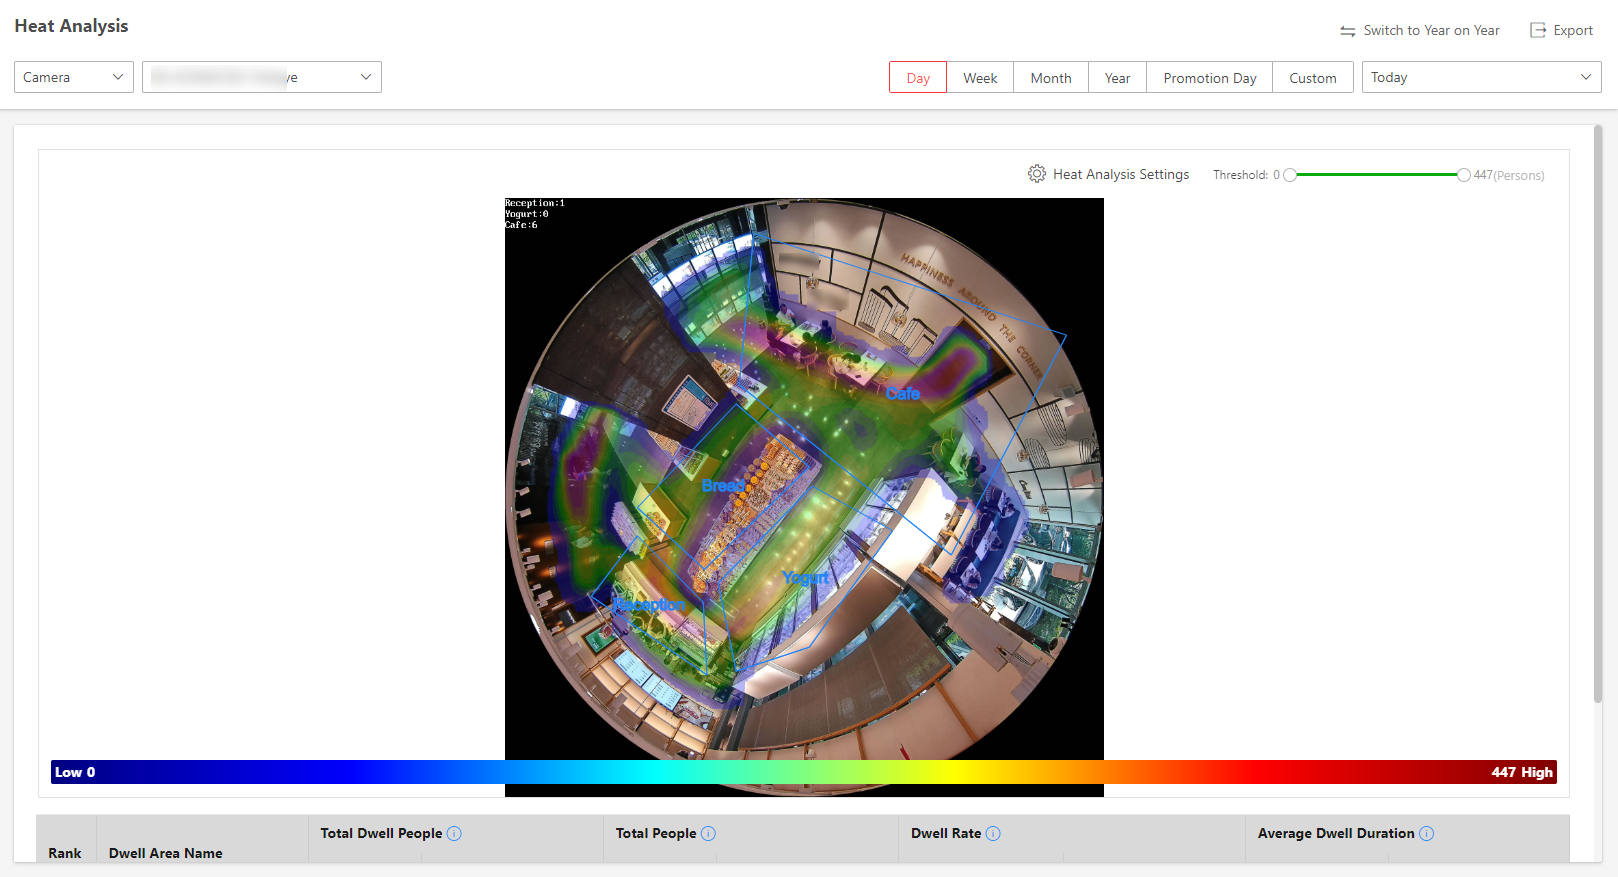
Store Heat Analysis Report: You can generate a heat analysis report to show consumer movements, the visit times, and dwell time in a configured area.
Figure 3 Store Heat Analysis ReportNote-
Make sure you have added a heat map network camera to the platform and properly configure the camera with heat map rule for the required area. To add a heat map network camera, please refer to the User Manual of HikCentral Professional Web Client. To configure the heat map rule, please refer to the user manual of heat map network camera.
-
Make sure you have added the camera to a static map. For details about how to add a camera to the static map, refer to User Manual of HikCentral Professional Web Client.
-
-
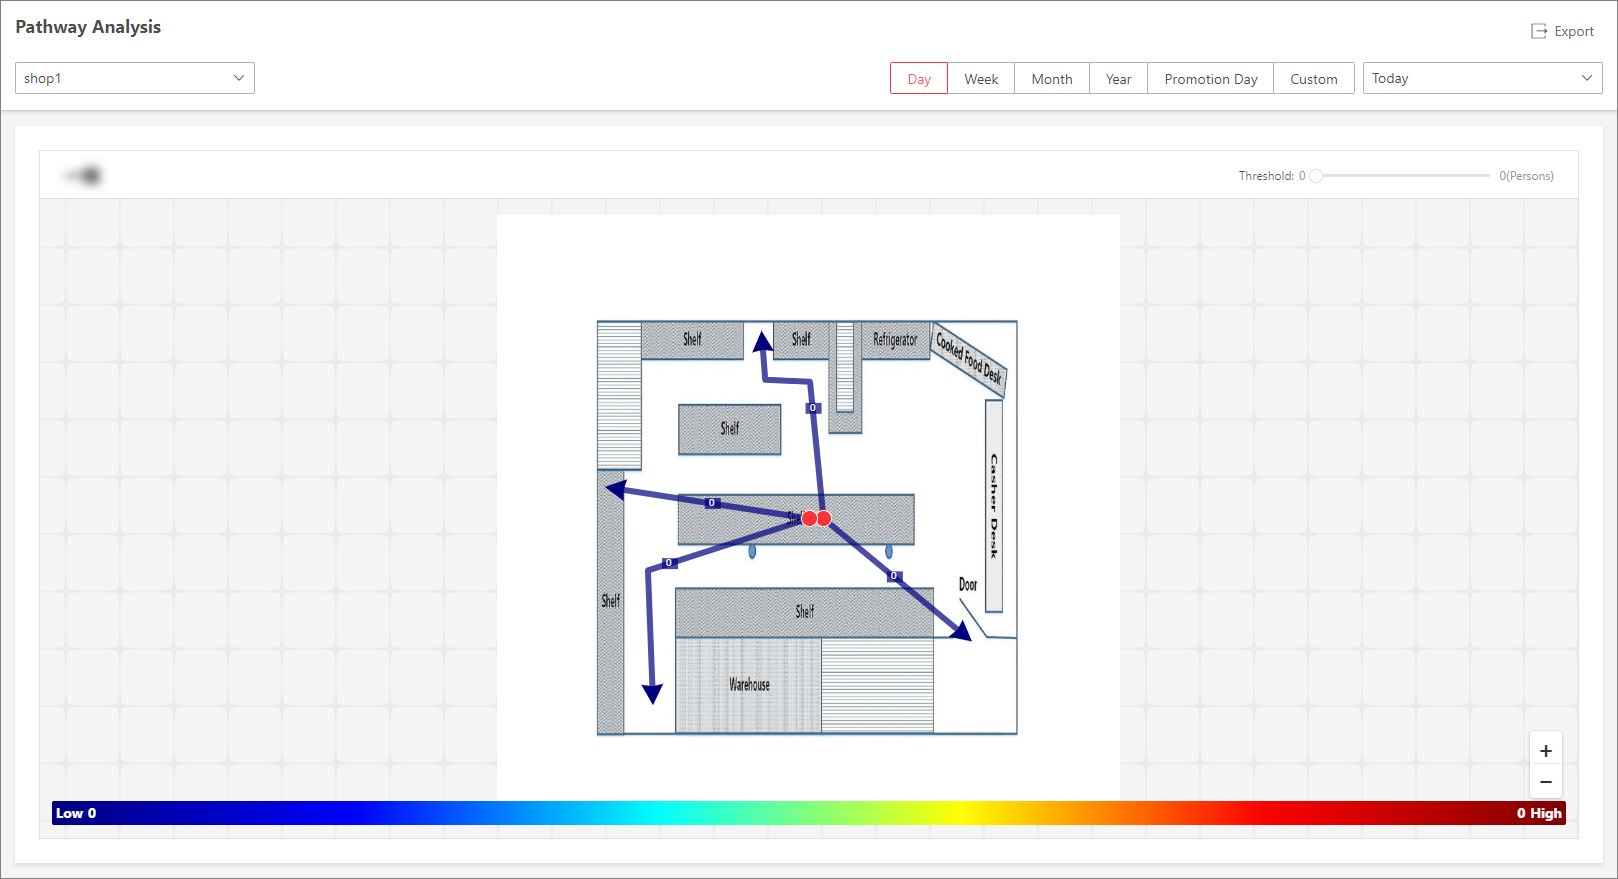
Store Pathway Analysis Report: Pathway analysis is mainly used to analyze the people counting on the pathways in the shopping malls. With the help of fisheye cameras, the platform can collect the consumers data (for example, where the customers walk mostly). This helps managers analyze which areas/shops of the mall best catch a shopper's attention and which are overlooked. After setting the fisheye camera's pathways and their directions, the platform calculates the people dwell time at each pathway and number of people walking by, thus helps them make decisions.
Figure 4 Store Pathway Analysis ReportNote-
Make sure you have properly added the camera to a static map and set its pathways on the map via the Web Client first. For details about adding camera to map and set pathways, refer to the User Manual of HikCentral Professional Web Client.
-
You should have added pathway analysis groups. For details, see Add Analysis Group.
-
-
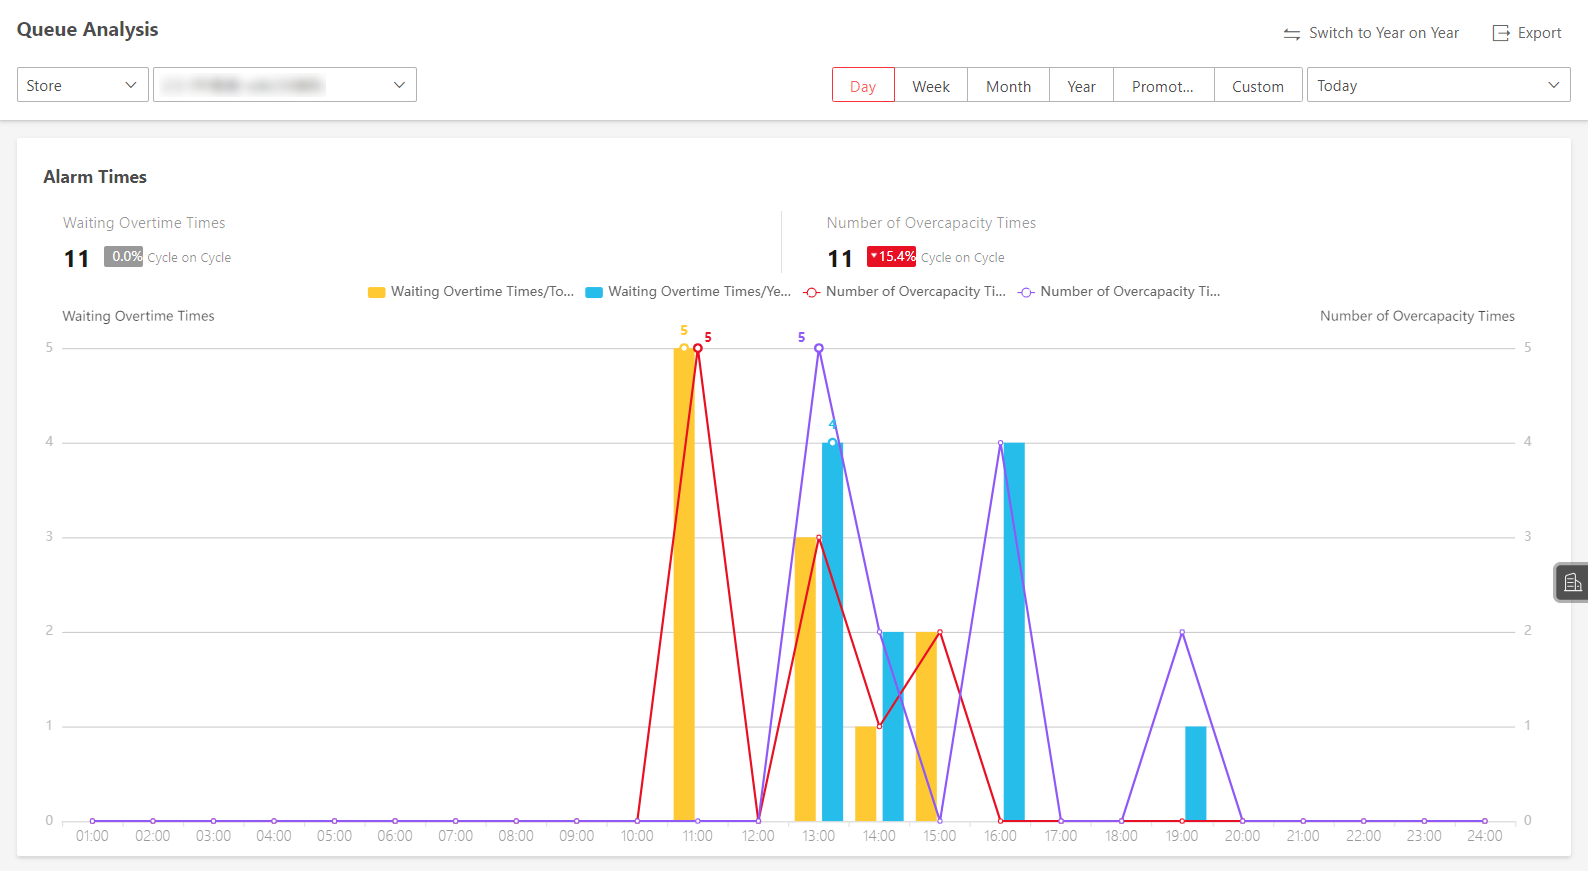
Store Queue Analysis Report: For cameras which support queue management, you can generate a report to show the number of queue exceptions and number of persons in each queue, and show the queue status including waiting duration and queue length.
Figure 5 Store Queue Analysis ReportNoteMake sure you have added a camera which supports queue management to the system and configure queue regions. To configure the queue region, refer to user manual of the camera.
See the example process of viewing a heat analysis report. Some specific parameter configurations may vary by reports.
-
Under the Intelligent Analysis module, select .
-
Select a store/camera to search for queue data. A queue analysis report of the selected camera/store will be displayed.
-
(Optional) Set the statistical cycle as Day, Week, Month, Year, Promotion Day, or Custom.
- Daily Report
-
Daily report shows data on a daily basis. The system will calculate the queue data detected in each hour of one day.
- Weekly Report, Monthly Report, and Annual Report
-
As compared to daily report, weekly report, monthly report, and annual report can be less time-consuming, since they are not to be submitted every day. The platform will calculate the number of people or people dwell time in each day of way week, in each day of one month, and in each month of one year.
- Promotion Day
-
Promotion day report shows data on a promotion day basis. The platform will send one report at the sending time on a promotion day, which contains analysis results on the day.
NoteFor details of configuring a promotion day, refer to Configure Promotion Day.
- Custom Time Interval
-
Users can customize the days in the report to analyze the number of people or people dwell time in each day or month of the custom time interval.
-
(Optional) Set the time or time period for statistics.
NoteFor custom time interval report, you need to set the start time and end time to specify the time period.
-
(Optional) Perform the following operation(s).
Operation
Description
Set Heat Analysis Parameters
-
Click Heat Analysis Settings.
-
Set the Dwell Duration to get statistics within the configured range.
NoteFor example, if you set the dwell duration as > 15s, then when a person stays in an area for over 15 seconds, they will be considered as dwelling within the area.
-
Select the Meaning of Heat Color, including total people and dwell time.
-
Check Show or Hide the divided heat areas.
-
Click Save.
-
Drag the threshold slider in the upper-right corner to adjust the range of the statistical dimension. The heat data out of the range will not be displayed.
Switch Between Year on Year and Cycle on Cycle
Click Switch to Year on Year / Switch to Cycle on Cycle to compare the report statistics in different ways.
NoteFor exporting reports, year on year statistics and cycle on cycle statistics will be both exported.
Export Report
-
Click Export.
-
Set the format of the exported file as Excel, CSV, or PDF.
-
Select the time dimension as By Hour, By Day, or By Month.
-
Click Export.
NoteYou can get the exported report in the Download Center.
-