Generate Queue Analysis Report
For cameras which support queue management, you can generate a report to show the number of queue exceptions and number of persons in each queue, and show the queue status including waiting duration and queue length.
Add a camera which supports queue management to the system and configure queue regions. To configure the queue region, refer to user manual of the camera.
-
In the top left corner of the platform,
select
 > Intelligent Analysis > Report > Queue Analysis.
-
Select a camera to search for queue data.
-
Click
 to open the resource
list.
to open the resource
list.
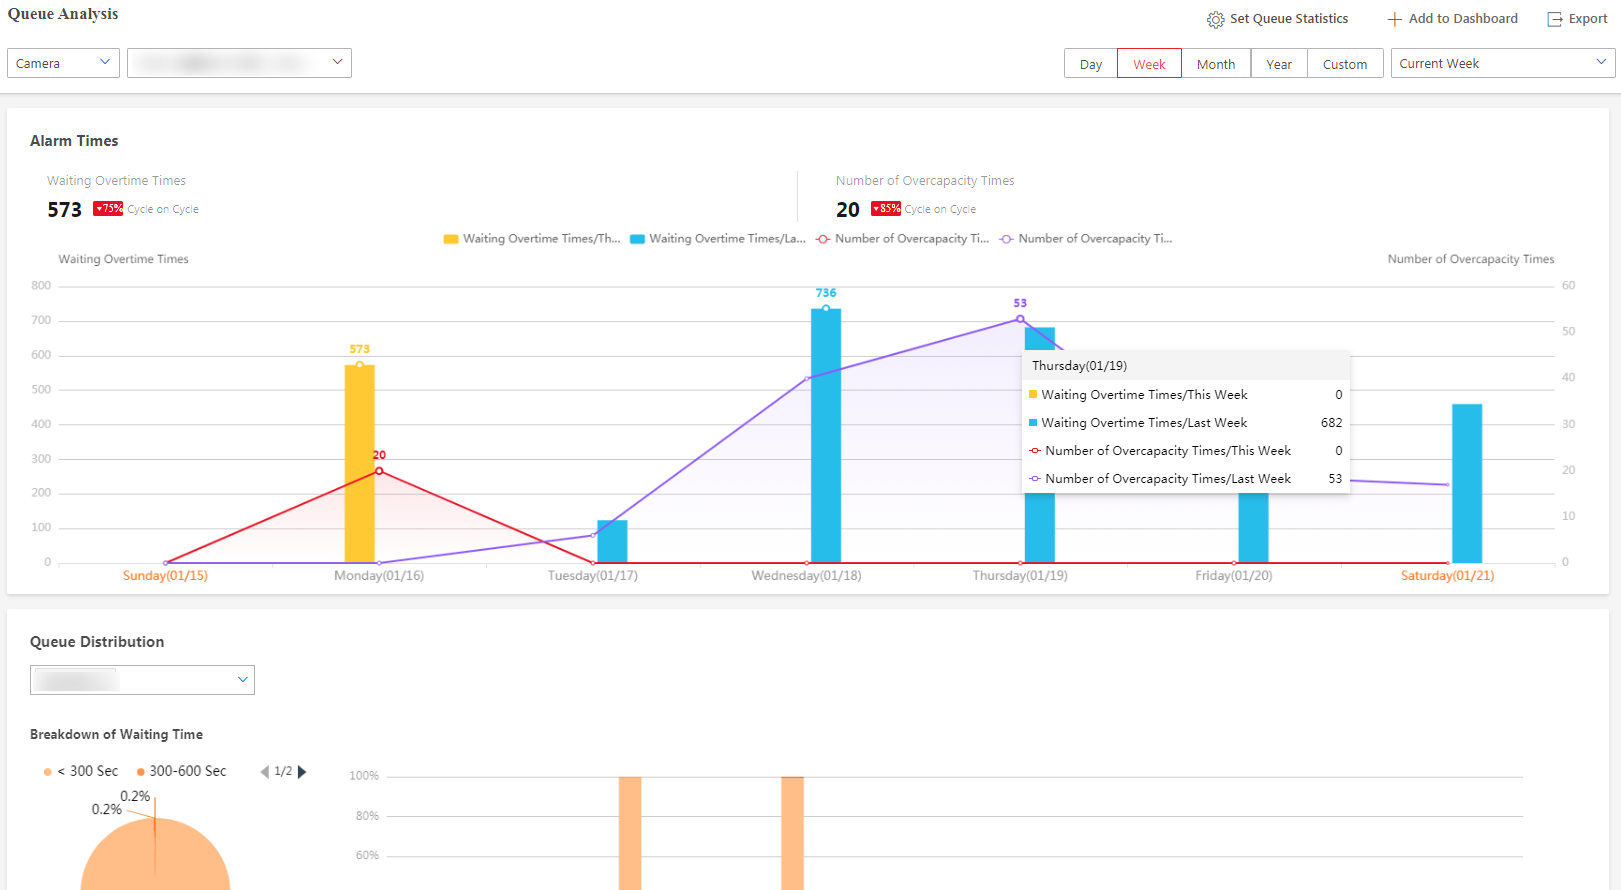 Figure 1 Queue Analysis Report
A queue analysis report of the selected camera is displayed.
-
Click
- Optional:
Perform the following operation(s) after generating the report.
Option Description Add Report to Dashboard
-
Click Add to Dashboard in the upper-right corner of the page.
-
Create a report name.
-
Select a dashboard. Or click New to create a new board and then select it.
-
Click OK or Add and Go to Dashboard.
Edit Statistic Range
-
Click Set Queue Statistics.
-
Set the statistic range of waiting time and number of queuing people.
For example, if you set the queue duration as Range1 < 300 < Range 2 <600 < Range 3. The platform will calculate the distribution of three ranges (shorter than 300 seconds, from 300 to 600 seconds, and longer than 600 seconds).
-
Click Save.
Show/Hide Certain Data
Click the legend to show or hide the data of certain element.
Filter Queue Distribution Data by Queue
Click
under
Queue Distribution to display configured
queue(s), and filter the data of queue duration and number of
queuing people by queue.Export Report
-
Click Export to export the report to the local PC.
-
Set the format of the exported file as Excel, CSV, or PDF.
-
Select the time dimension as By Hour, By Day, or By Month.
-
Click Export.
-