Generate People Density Analysis Report
You can manually generate a people density report to view the people density data of two adjacent time period. You can also export the report to the local PC.
-
Make sure you have purchased the License that supports people density analysis, or the function will be unavailable.
-
Make sure you have added the abnormal event detection server to the HikCentral Professional and linked cameras to the server.
-
Make sure you have configured people density analysis on the abnormal event detection server. For details, see the user manual of the server.
-
In the top left corner of the platform,
select
 > Intelligent Analysis > Report > People Density Analysis.
-
Select a camera to search for people density data.
-
Click
 to open the resource
list.
to open the resource
list.
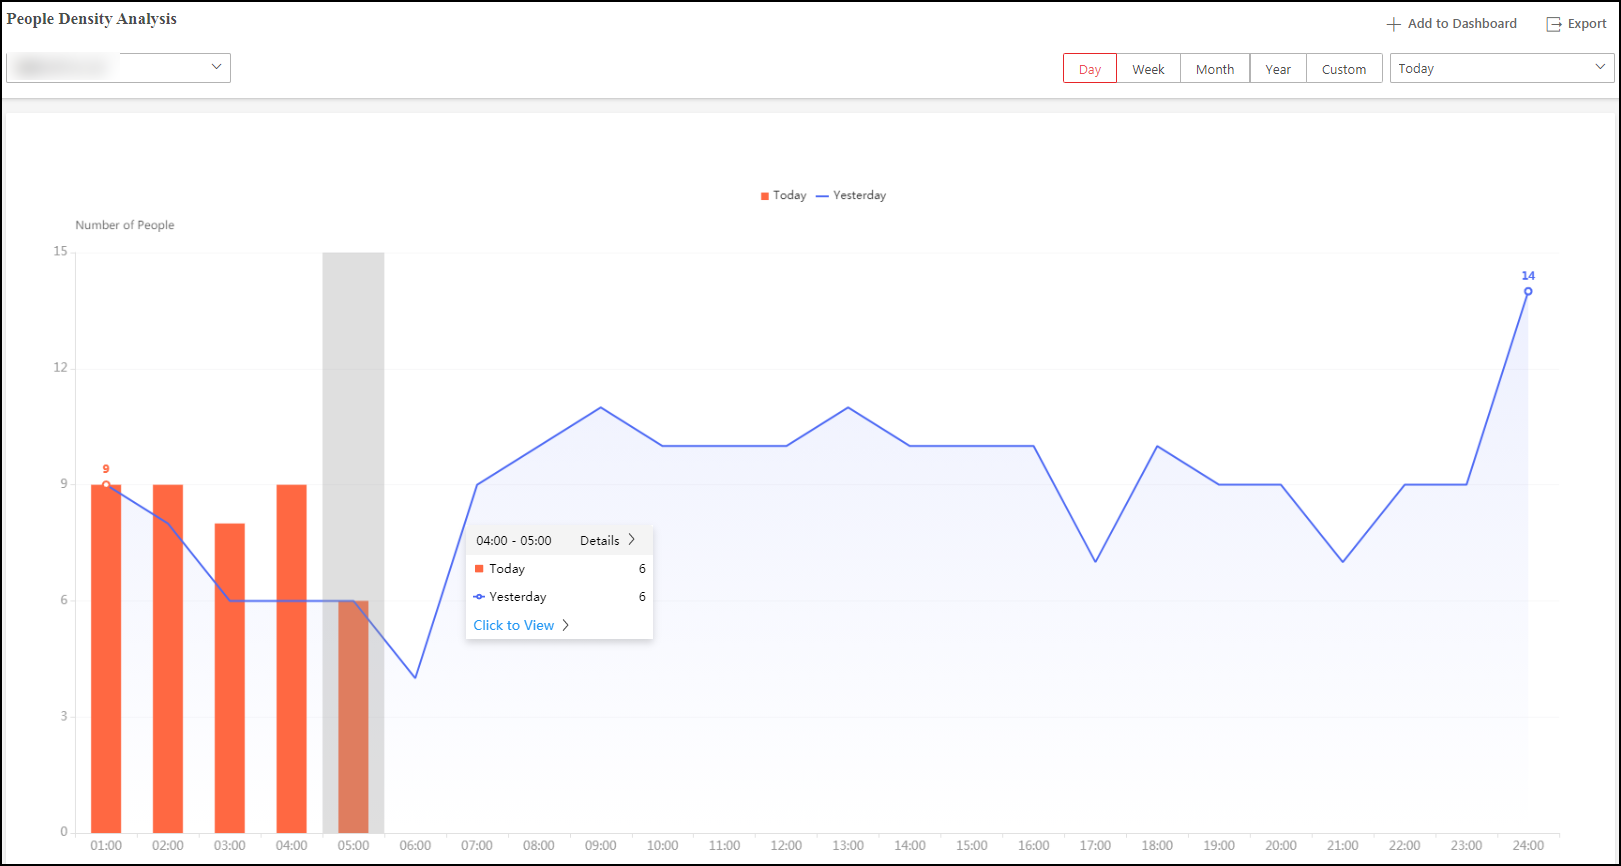 Figure 1 People Density Analysis Report
A people density report of the selected camera is displayed.
-
Click
- Optional:
Perform the following operations if required.
Option Description Add Report to Dashboard
-
Click Add to Dashboard in the upper-right corner of the page.
-
Create a report name.
-
Select a dashboard. Or click New to create a new board and then select it.
-
Click OK or Add and Go to Dashboard.
Show/Hide Certain Data
Click the legend to show or hide the data of certain element, such as certain camera.
View Detailed Data in Each Time Segment
Hover the cursor onto the line chart to view the detailed data.
View Linked Video
Hover the cursor on the statistics of a time period and click Click to Viewon a pop-up floating window to view the video of the time period.
Note:Viewing linked videos is not supported by annual report.
View Detailed Data in Each Minute
Note:Viewing detailed data in each minute is only supported by daily report.
-
Generate a daily report.
-
Select a camera at the bottom of the line chart to display its statistics only.
-
Hover the cursor onto the report and then click Details on the pop-up floating window.
A report that shows statistics in each minute will be displayed.
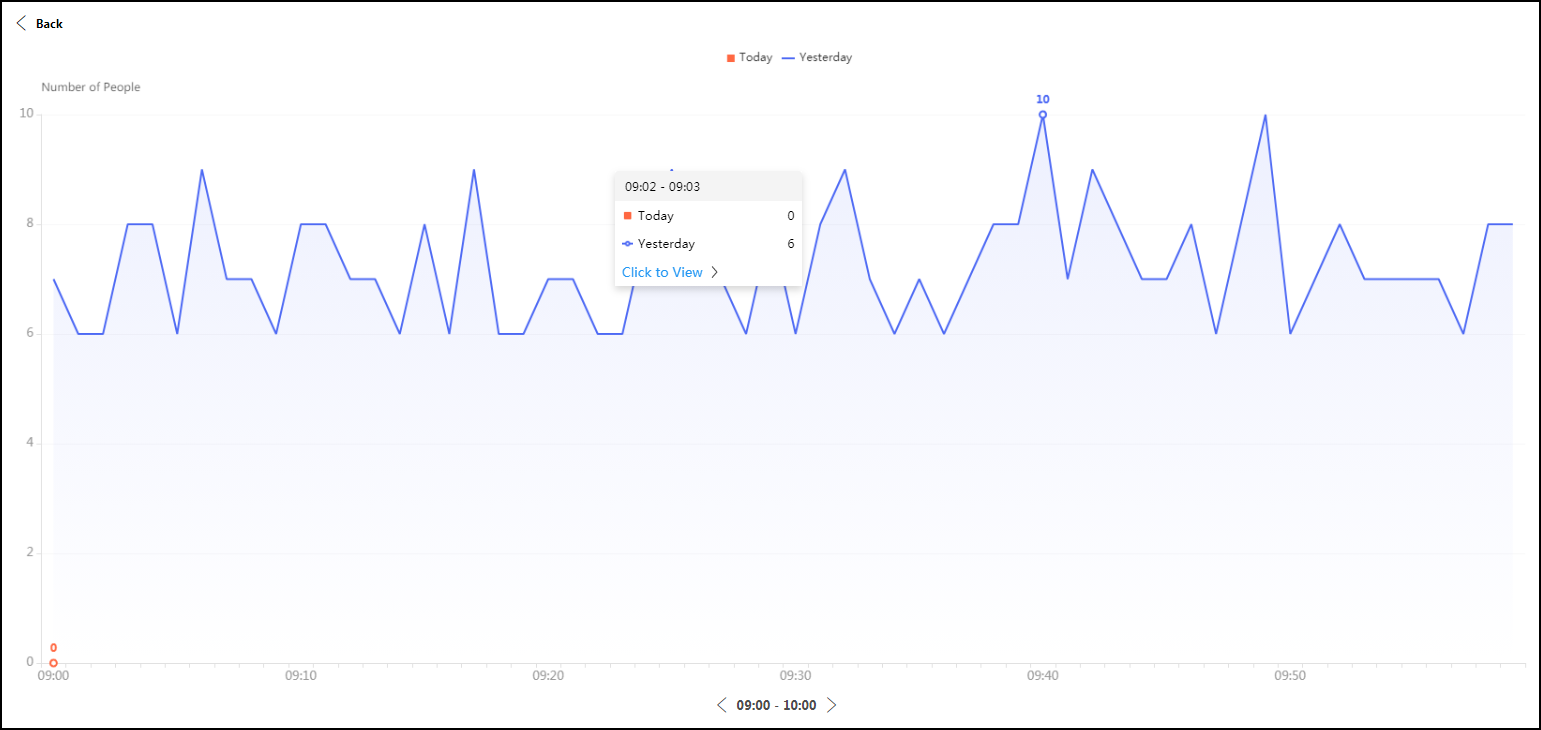 Figure 2 View Detailed Data In
Each Minute
Figure 2 View Detailed Data In
Each Minute -