Generate and View Analysis Report
Generate and view people counting reports, heat analysis reports, person feature analysis reports, queue analysis reports, pathway analysis reports, people density reports, temperature analysis reports, and multi-target-type analysis reports. For people counting report, heat analysis report, pathway analysis report, and person feature analysis report, make sure you have added the corresponding analysis groups. After that, you can set a regular report rule for the specified analysis groups/cameras, and the system will send emails with the reports attached to the target recipients daily, weekly, or monthly. You can also manually generate an analysis report at any time to view the data if required.
People Counting Report
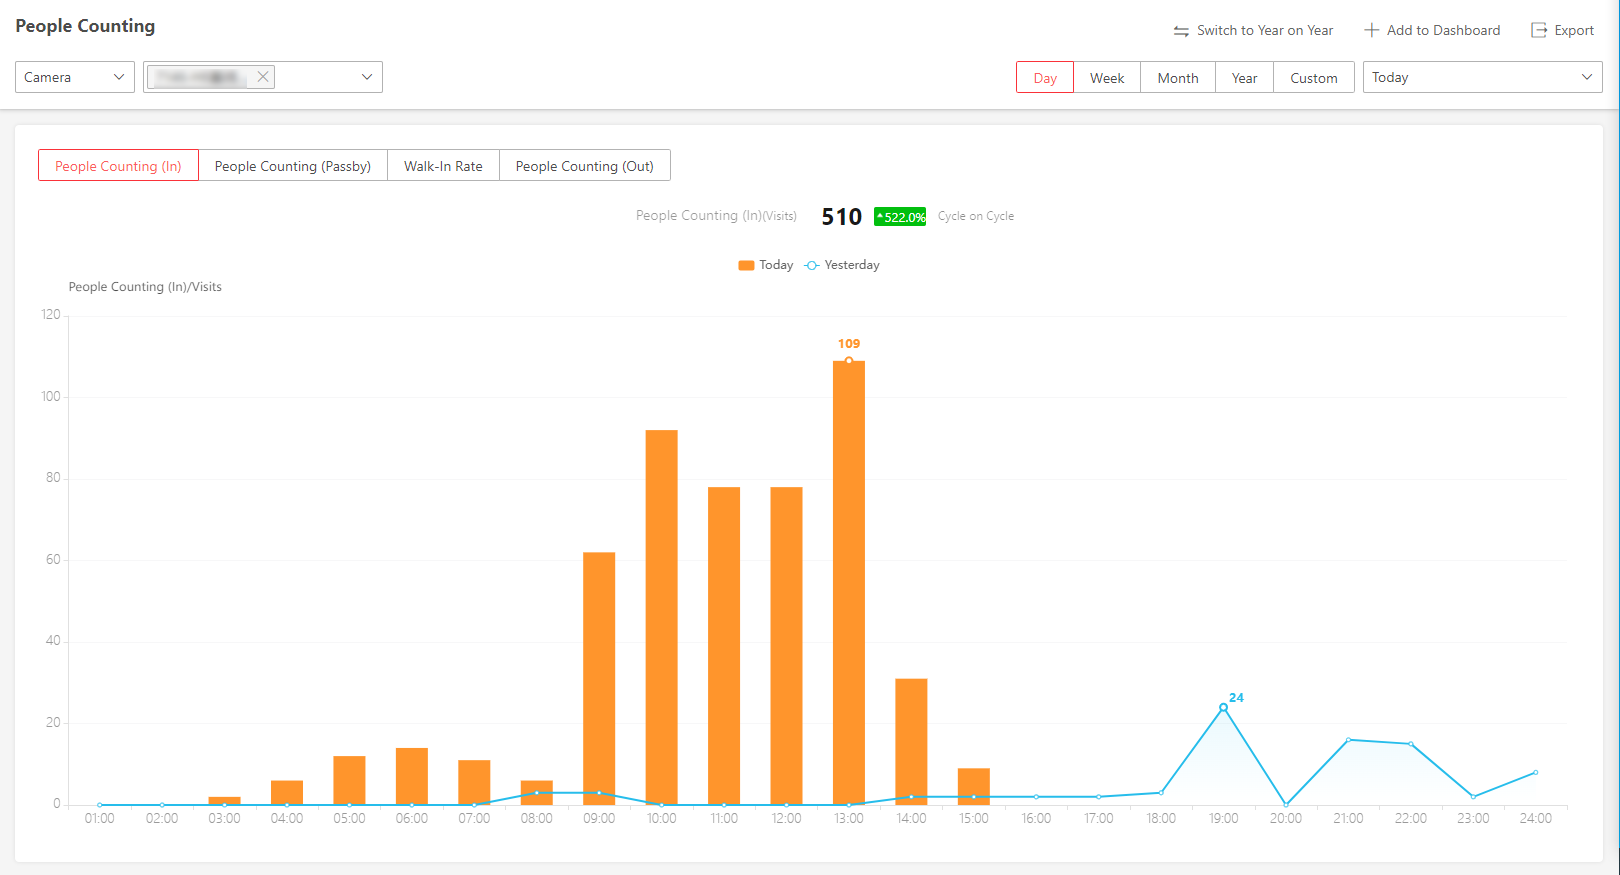
People counting report shows the number of line crossing people counted by people counting cameras or obtained from access records of access control devices in a specific region and within a certain time period. The report lets you know the number of persons who stay in a specific region, which can be used for certain commercial or emergency scenarios. For example, for emergency scenario, during a fire escape, the number of stayed persons will be displayed on the map which is required for rescue. For commercial scenario, the shopping mall manager can get the people counting report to know whether the store is attractive and get the number of people entering each stores to determine whether to limit the number of customers staying in the mall for security reasons during the peak time. You can also generate a people counting report for a single store or multiple stores.
Before generating a people counting report, you should add people counting group(s) to group the doors and people counting cameras of a certain region so as to define region edge.
Heat Analysis Report
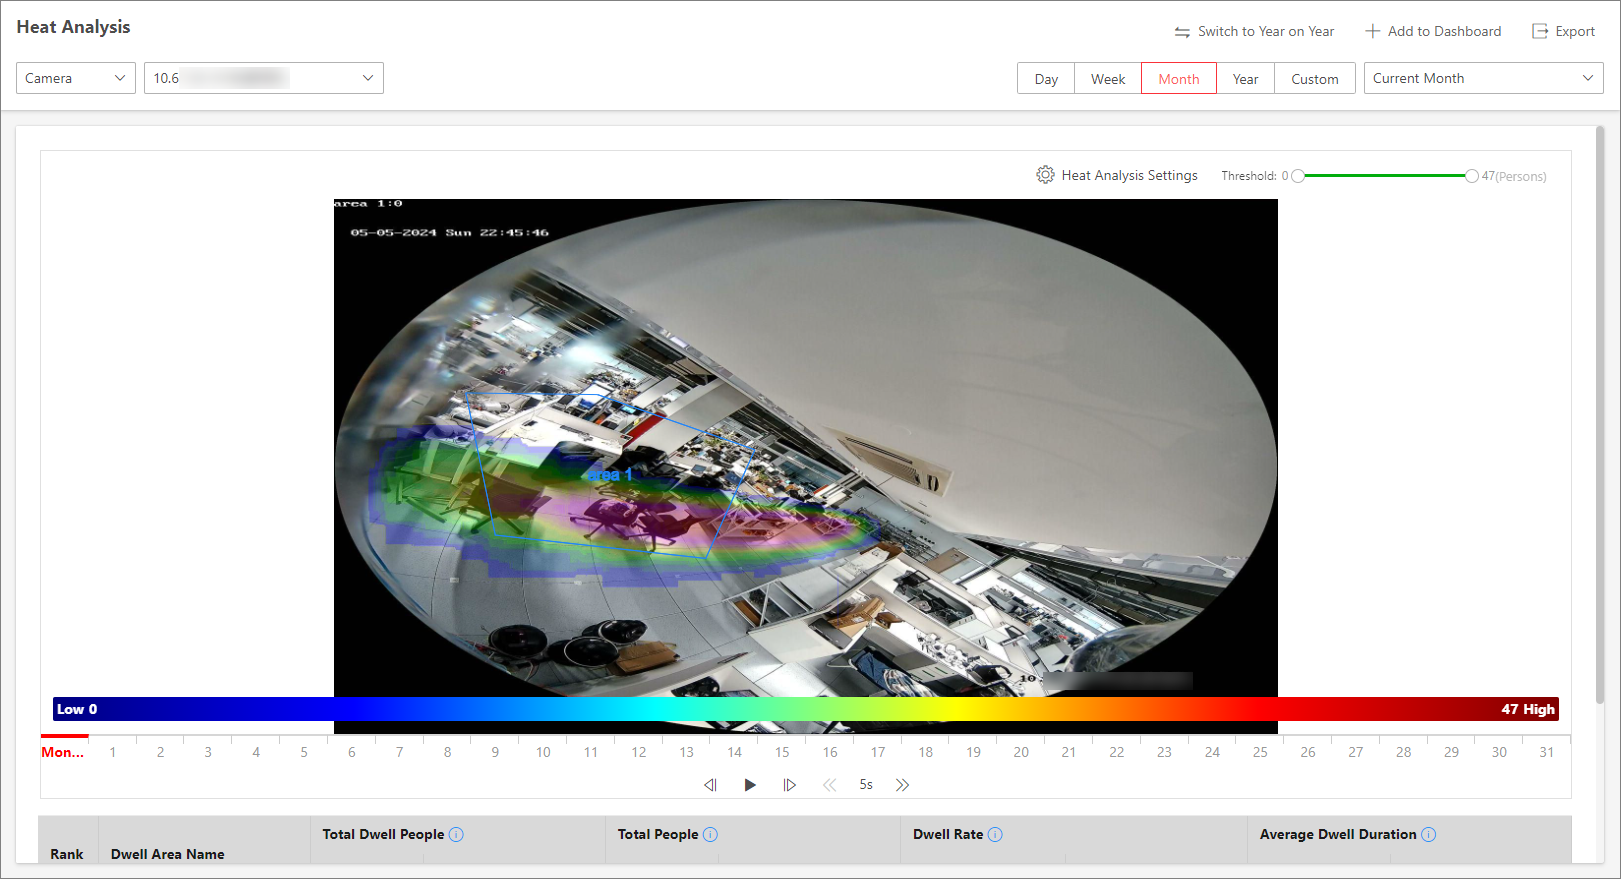
Heat analysis report shows data with a heat map, which is a graphical representation of data represented by colors. The heat map function of the camera is usually used to track the consumers movements (where the customers walk, and what items they stop to touch and pick up) and analyze the visit times and dwell time in a configured area. This report is mainly used for store managers or retailers to see which part of the store got the most attention from consumers and which got least. Knowing where customers move is useful for retailers. They can optimize store layouts, for example, where to place popular and unpopular goods.
Before you begin:
-
Make sure you have added a heat map network camera to the platform and properly configure the camera with heat map rule for the required area. To configure the heat map rule, please refer to the user manual of heat map network camera.
-
Make sure you have added the camera to a static map.
-
Make sure you have added a heat analysis group to define the region for heat analysis.
Person Feature Analysis Report
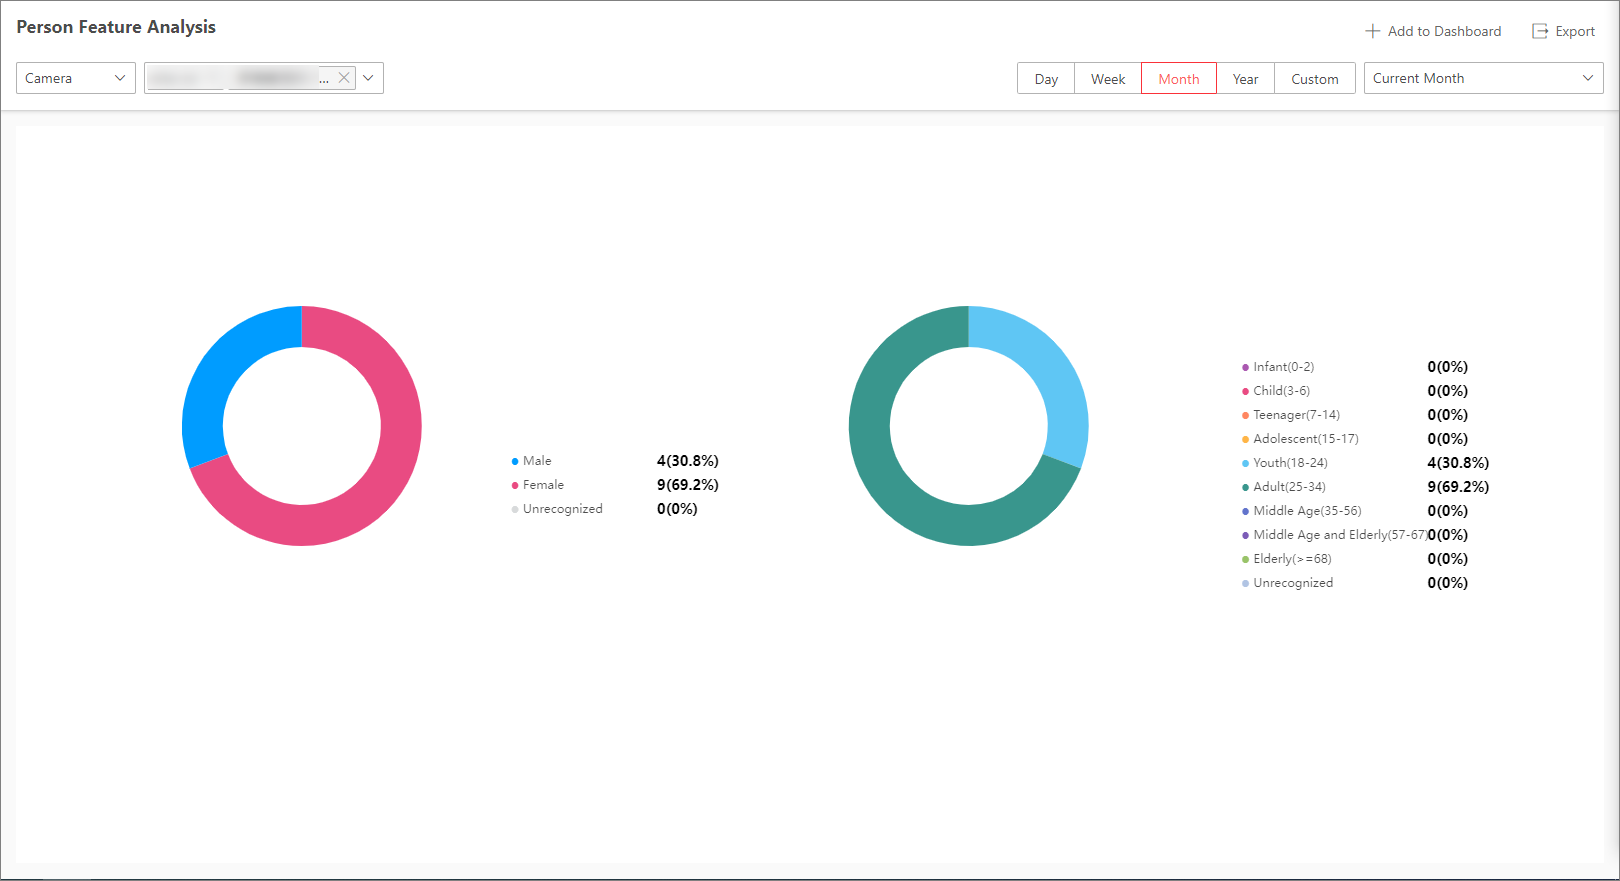
The platform supports saving features of recognized human faces and generating reports in various time periods. The reports tells the percentage and number of people of different features detected by cameras in different time period. It can be used in places such as shopping mall to analyze interests of people in different features.
You should add a person feature analysis group (Add Analysis Group) before generating a report to define the region for person feature analysis by grouping the cameras which support facial recognition and feature analysis.
Queue Analysis Report
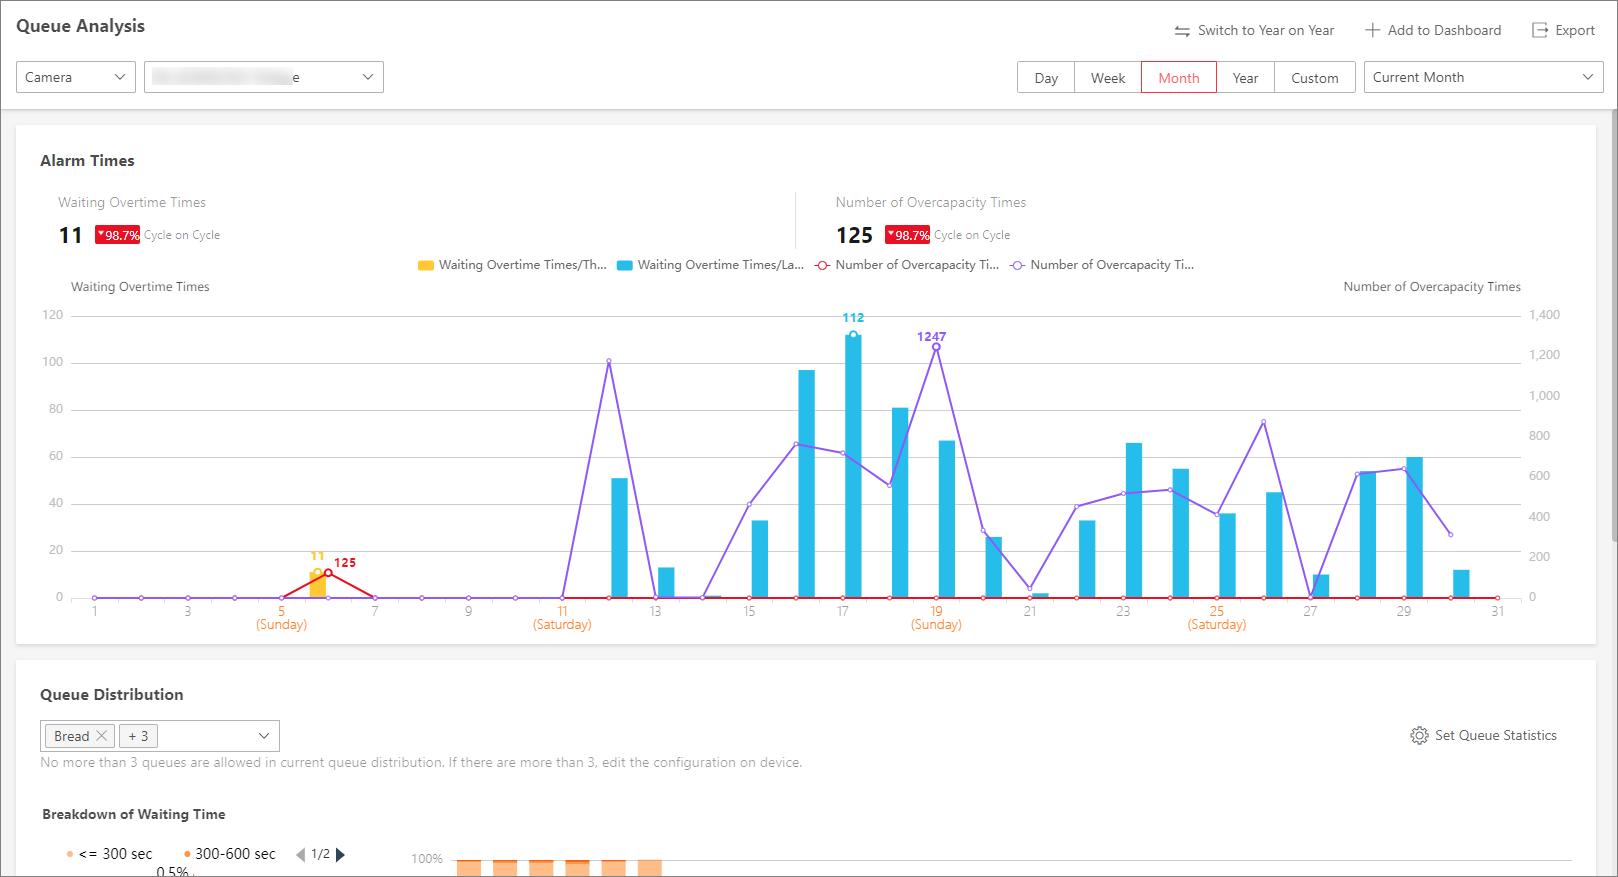
Queue analysis report shows the number of queue exceptions and number of persons in each queue, and show the queue status including waiting duration and queue length. It is helpful for allocating resources for retailers.
Before you begin, make sure you have added a camera which supports queue management to the system and configure queue regions. To configure the queue region, refer to user manual of the camera.
Pathway Analysis Report
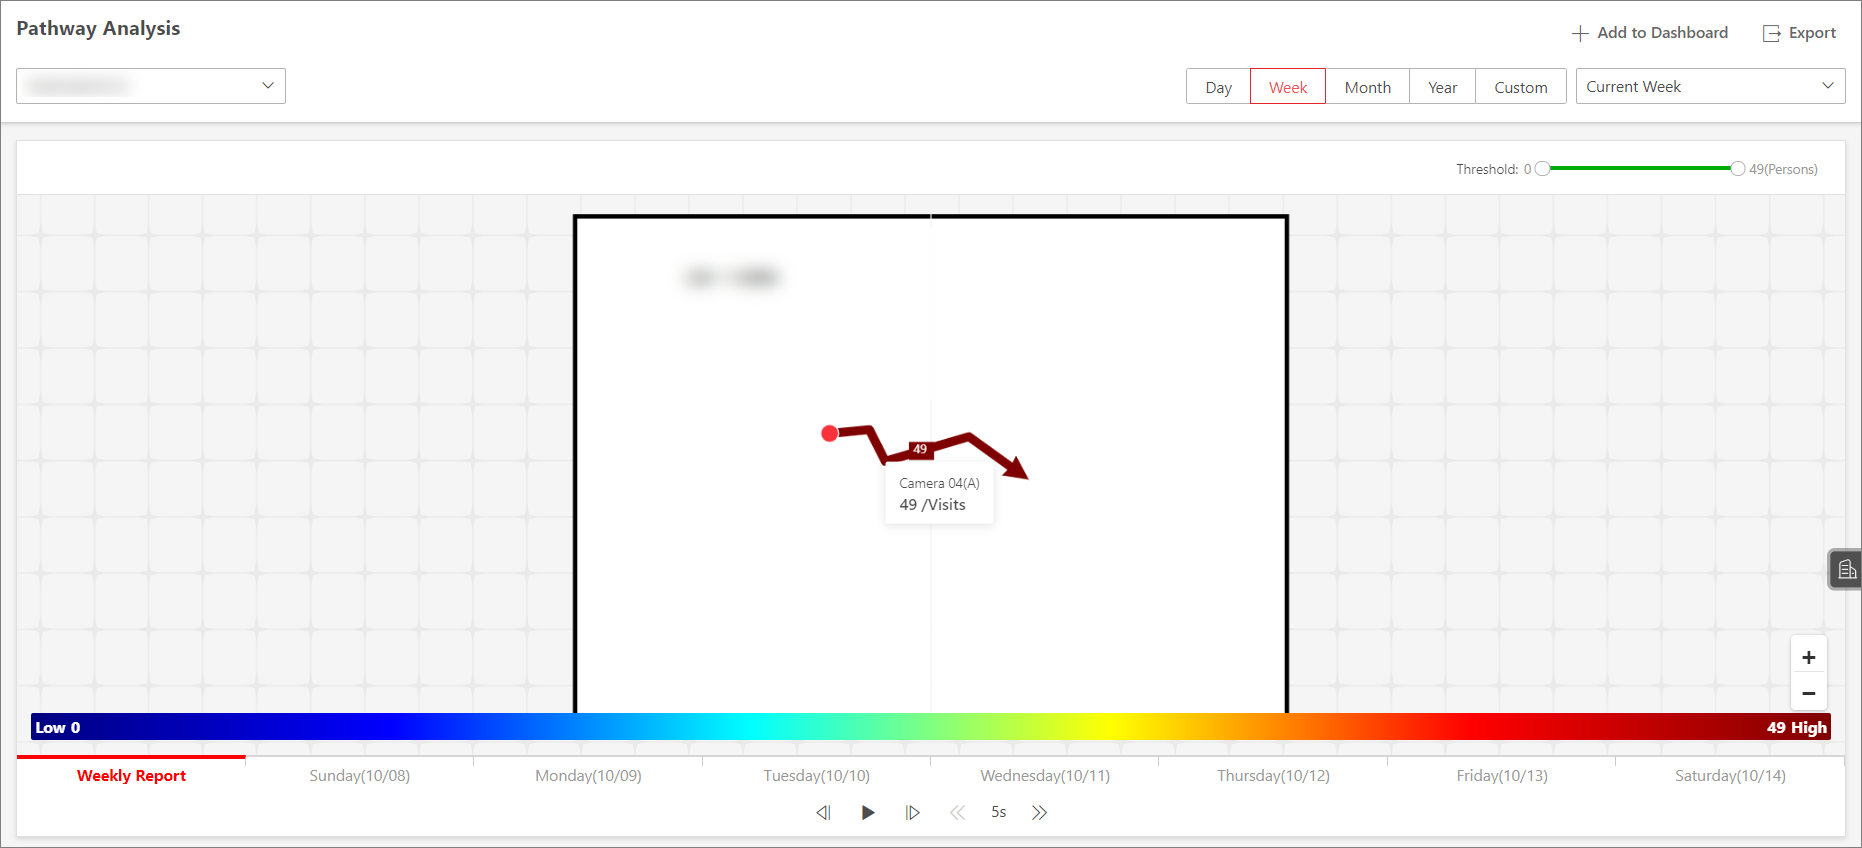
Pathway analysis is mainly used to analyze the people counting on the pathways in the shopping malls. With the help of fisheye cameras, the system can collect the consumers data (for example,where the customers walk mostly) and translate that data onto a dashboard for mall managers. This helps managers analyze which areas/shops of the mall best catch a shopper's attention and which are overlooked. After setting the fisheye camera's pathways and their directions, the platform calculates the people dwell time at each pathway and number of people walking by, thus helps them make decisions.
Before you begin:
-
Make sure you have properly added the camera to a static map and set its pathways on the map via the Web Client first. For details about adding camera to map and set pathways, refer to the User Manual of HikCentral Professional Web Client.
-
Before you begin, make sure you have added pathway analysis groups. For details, see Add Analysis Group.
People Density Analysis Report
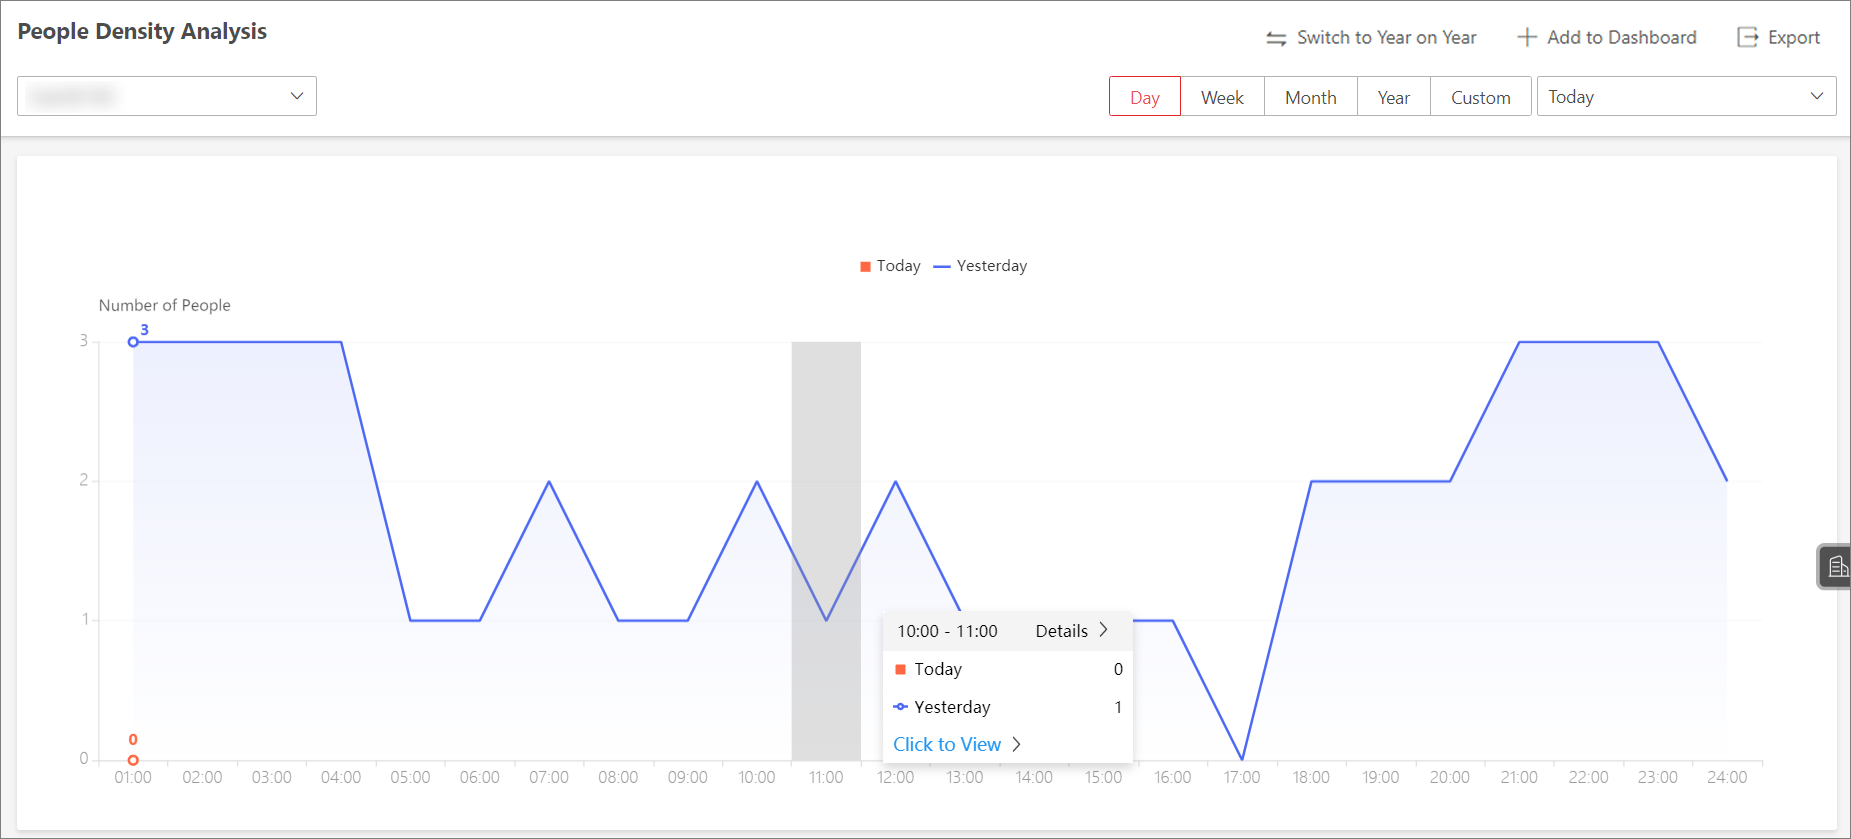
People density analysis report shows the variation trend of the people density data in line chart. The people density data refers to the peak amount of people appeared in the images of a specific camera during a certain time period. The data is useful for the management and control of the amount of people in specific areas or space during special time periods. For example, assume that you were a manager of a shopping mall during epidemic outbreak, you could generate a people density analysis report to find out the time period(s) during which excessive people density usually occurs in the shopping mall, and then arrange in advance the personnel and related works accordingly to limit people gathering at those time periods to prevent the spread of the infectious disease.
-
Before you begin, make sure you have purchased the License that supports people density analysis, or the function will be unavailable.
-
Before you begin, make sure you have added the abnormal event detection server to the HikCentral Professional and linked cameras to the server.
-
Before you begin, make sure you have configured people density analysis on the abnormal event detection server. For details, see the user manual of the server.
Temperature Analysis Report
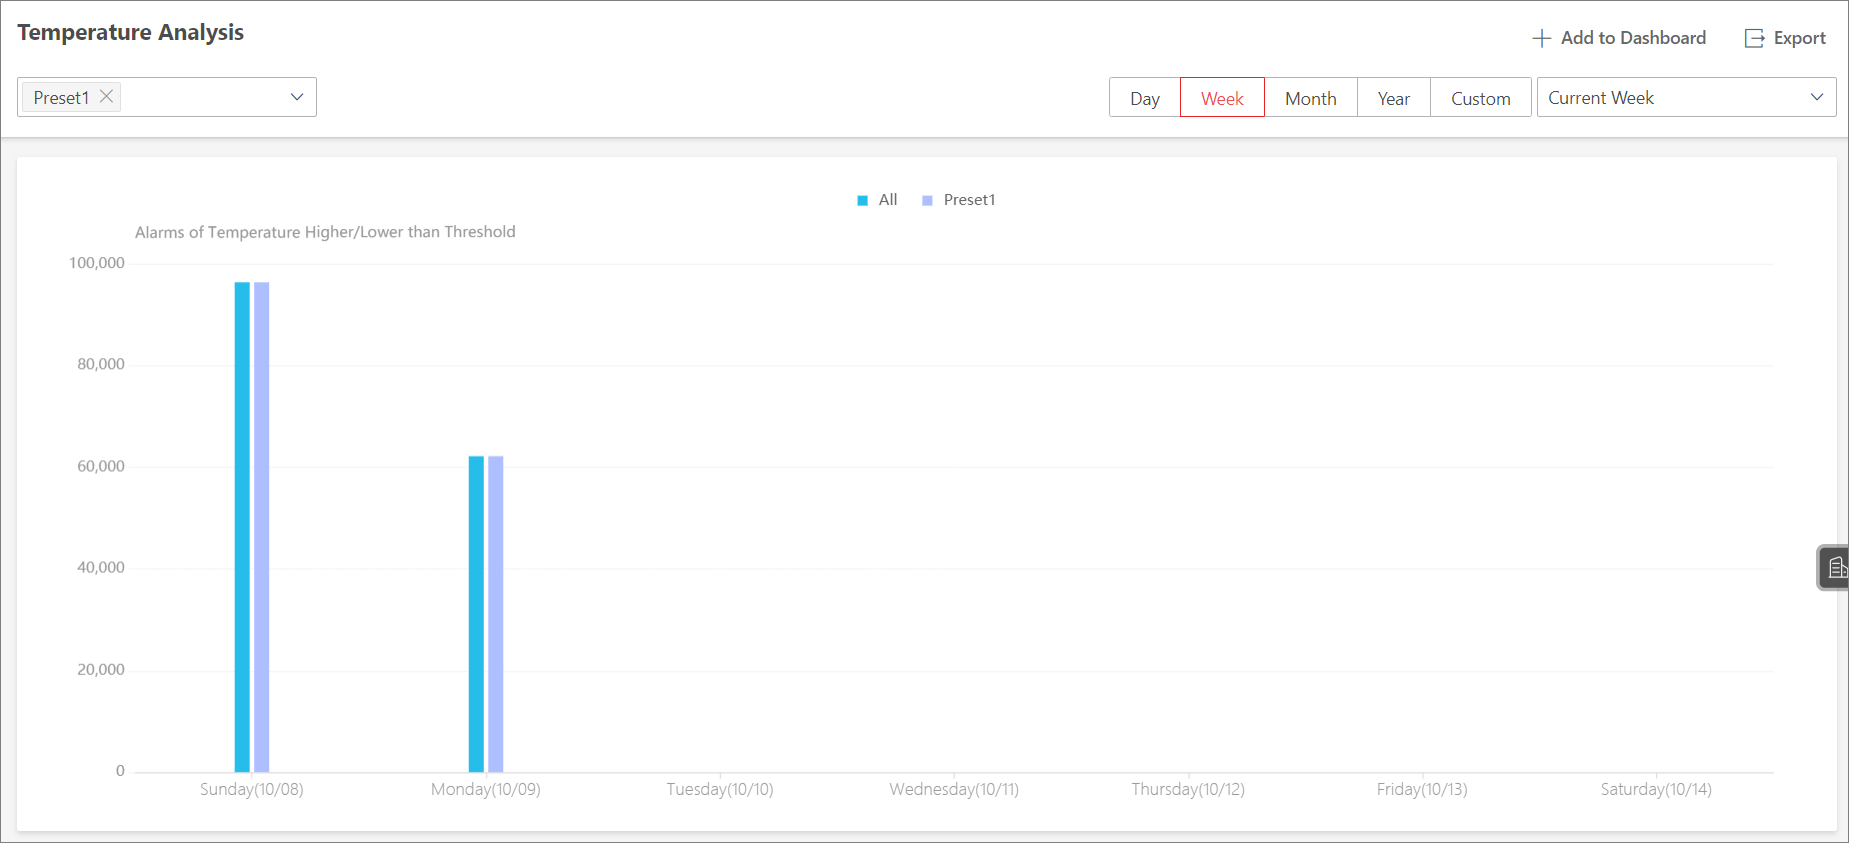
The temperature analysis report shows the number of exceptions (temperature too high or too low) and maximum/minimum temperature of different thermometry points on different presets.
Multi-Target-Type Analysis Report
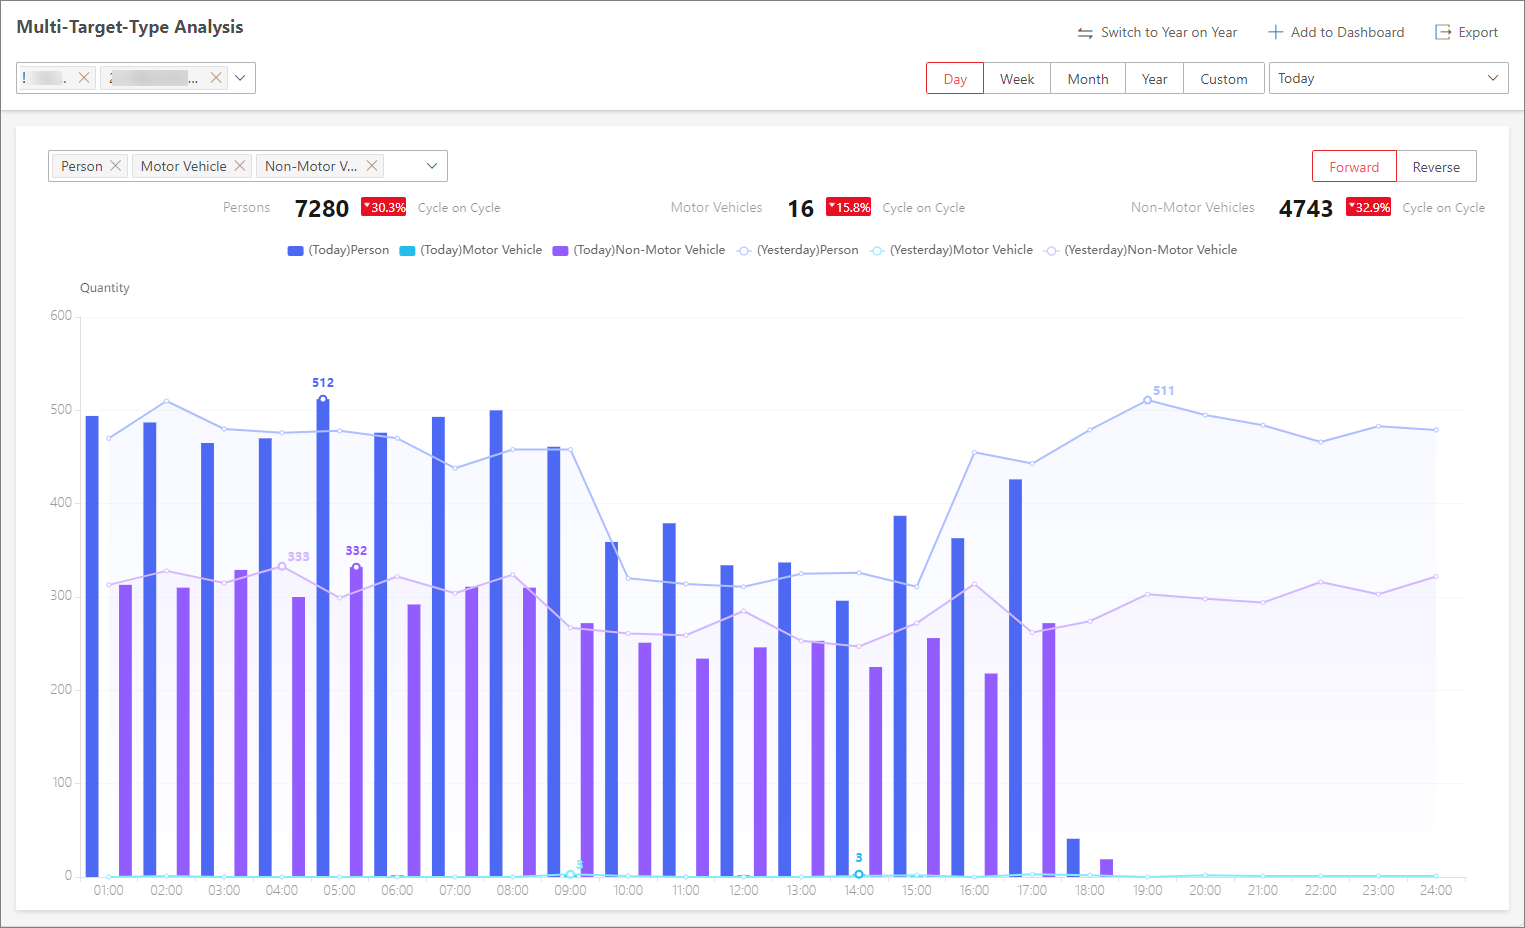
The multi-target-type analysis report shows the number of persons, motor vehicles, and non-motor vehicles within a specified period. You can set a regular report rule for the specified cameras and the system will send emails with reports attached to the target recipients daily, weekly, or monthly. You can also manually generate a analysis report at any time to view the data if required.
Generate Analysis Report
The process of generating these reports can be generally divided into 4 sections: selecting report data resource, setting statistical cycle, setting the time or time period for statistics, and perform subsequent operations on the report as needed. Some specific parameter configurations may vary by reports.
See the example process of generating a people counting report.
-
Under the Intelligent Analysis module, select .
-
Select the report data resource type.
- Camera
-
A people counting report based on the data from the cameras you select will be generated. You can compare the data of different cameras.
- Analysis Group
-
A people counting report based on the data from the people counting groups you select will be generated. You can compare the data of different groups.
NoteMake sure you have added people counting groups. See Add Analysis Group for details.
-
Select people counting camera(s) or people counting group(s) based on the data resource type you set in the previous step.
NoteUp to 20 cameras/groups can be selected.
The corresponding report of selected camera(s)/group(s) will be displayed.
Figure 9 People Counting Report -
Set the statistical cycle as Day, Week, Month, Year, or Custom.
- Daily Report
-
Daily report shows data on a daily basis. The platform will display the people counting data detected in each hour of two adjacent days.
- Weekly Report, Monthly Report, and Annual Report
-
As compared to daily report, weekly report, monthly report, and annual report can be less time-consuming, since they are not to be submitted every day. The platform will display the people counting data detected in each day of two adjacent weeks, in each day of two adjacent months, and in each month of two adjacent years.
-
Select a pre-defined time period or customize a time period for statistics.
NoteFor custom time interval report, you need to set the start time and end time to specify the time period.
-
Perform the following operation(s) after generating the people counting report.
Operation
Description
Switch Between Year on Year and Cycle on Cycle
Click Switch to Year on Year / Switch to Cycle on Cycle to compare the report statistics in different ways.
NoteFor exporting reports, year on year statistics and cycle on cycle statistics will be both exported.
Add to Dashboard
-
Click Add to Dashboard in the upper-right corner of the page.
-
Create a report name.
-
Select a dashboard. Or click New to create a new board and then select it.
-
Click OK or Add and Go to Dashboard.
Export Report
-
Click Export.
-
Check/uncheck All for Statistics Target. When it is checked, only Excel will be available for file type in the next step.
NoteThis option is only available for people counting analysis report.
-
Set the format of the exported file as Excel, CSV, or PDF.
-
Select the time dimension as By Hour, By Day, or By Month.
-
Click Export.
-