Event and Alarm Overview
In the event and alarm overview module, it gives you an overview of the event or alarm distribution, top 5 event types or alarm categories, and top 5 event or alarm areas.
In the top left corner
of the Home page, select  > Security Monitoring > Event and Alarm.
Select on the left.
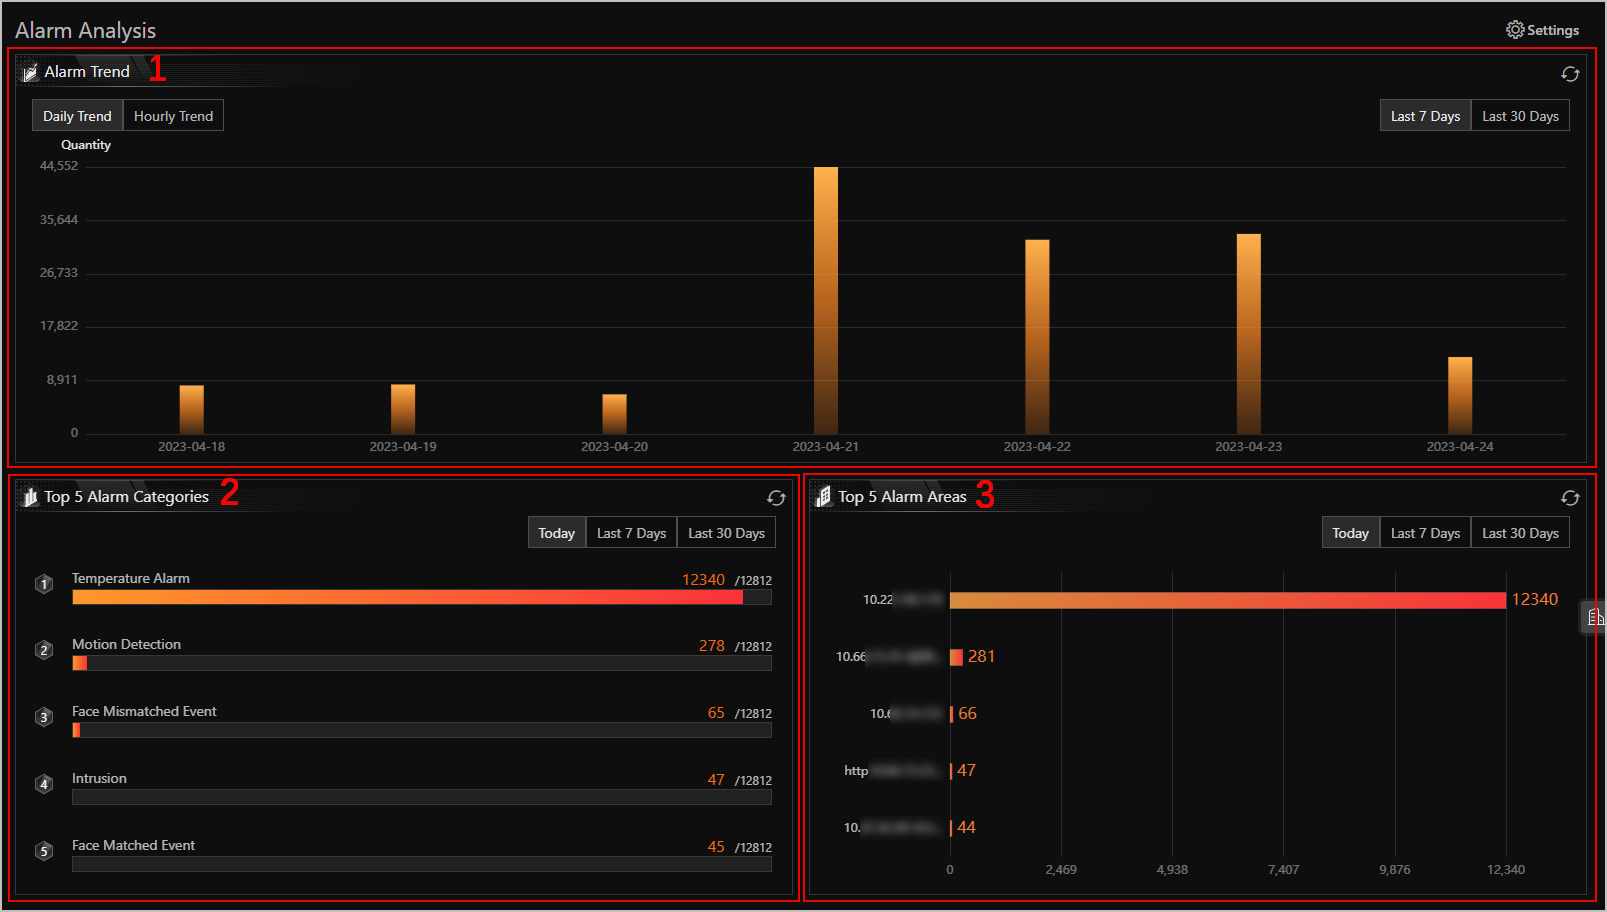 Figure 1 Event and Alarm Analysis
|
Module |
Description |
|---|---|
|
1 |
|
|
2 |
The data of top 5 event types or alarm categories triggered in the current day, last 7 days or last 30 days are displayed in the horizontal bar chart. You can click the red number of an item to jump to the Event and Alarm Search page. |
|
3 |
The data of the top 5 event or alarm areas in the current day, last 7 days or last 30 days are displayed in the horizontal bar chart. |
You can click Settings in the upper-right corner to customize event types or alarm categories to be calculated on the overview page.
The information displayed in each area will change according to the report target on the Settings pane. For example, if you select Alarm on the Settings pane as the report target, the upper area will only display the number of alarms, the lower-left area will only display the data of top 5 alarm categories, and the lower-right area will only display the data of top 5 alarm areas.